I focus much of my investing energy in the “high yield” area, finding stocks that pay out highish yields (8-12%, these days). Unless the company really hits hard times and has to cut its payout, I know I will make those returns over the next twelve months. But with ordinary stocks, you cannot count on any particular returns. The price of any stock a year from now will be the earnings per share (which can be forecasted with some degree of accuracy) times the price/earnings ratio, which is largely dependent on the emotions (“animal spirits”, in the words of Keynes) of the millions of market participants. Will I find a “greater fool” to buy my Amazon stock in a year for 20% more than I paid for it??
I have never gotten really comfortable with that as an investing model, and so I have erred on the side of caution and generally held less than the recommended 60% or so of my portfolio in plain stocks. In hindsight, that was a mistake. Every $10,000 put into the plain, dumb S&P500 fund SPY twenty years ago has turned into roughly $200,000. One reason for my caution has been a steady stream of articles that always warn that stocks are overvalued; after going up so much in the past X years, surely returns will be poor for the next several years.
But I try to learn from my mistakes, and I am now forcing myself to hold more equities than I “feel” like. To support this hopefully rational behavior, I am paying more attention to articles that present bull cases for stocks. One author on the Seeking Alpha investing site who has been consistently and correctly bullish for the past two years is Lawrence Fuller. Here I will summarize his Oct 9 article with the tongue-in-cheek title Be Afraid, Be Very Afraid. (To read articles on Seeking Alpha, you may have to start a free account, where you just have to give them an email address; I use my secondary “junk” email for these sorts of applications, which tend to send a lot of junky (not malicious) notifications).
He first addressed the angst that says, “Stocks have already run up so much, they are due for a crash”, by means of this chart showing cumulative returns in preceding bull markets:
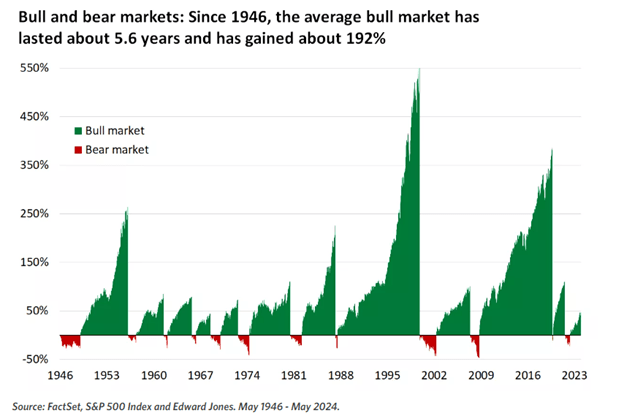
It is obvious that, compared to the average bull market, we are still in early innings with the present bull which started in Oct 2022.
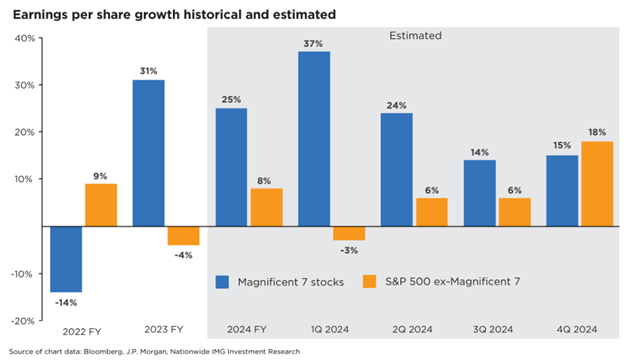
Fuller also makes the case that the good news on earnings has spread recently from the so-called Magnificent Seven big tech stocks (Microsoft, Apple, Nvidia, etc.) to the broader market. This should serve to support further price rises in the broad indices:
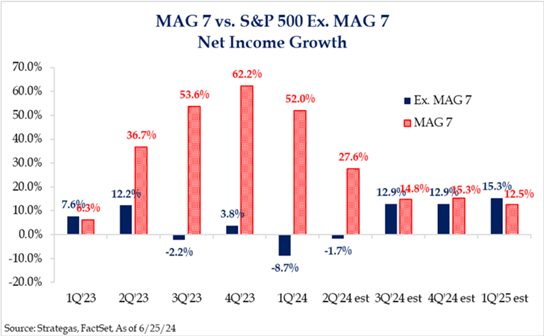
The chart below, which shows a similar story, in terms of net income growth:
He concludes:
“It is also important to recognize that the valuation of the S&P 500 is far more reasonable when we exclude the exceedingly expensive Magnificent 7 and focus on the remaining 493. In fact, we don’t have the valuation problem that bears purport we have today. Hence, I advised investors to avoid the market-cap-weighted indexes and focus on equal weight or look at sectors that had been left behind during the bull market to date…Therefore, I suggest not succumbing to fear. Instead, focus on whether the weight of evidence suggests we should be in wealth accumulation mode or wealth preservation mode.”
In a follow-up article, Are You Worried About An Overvalued Market? , Fuller notes that small cap stocks (as defined by the Russel 2000 index, which is held by the IWM fund) are more reasonably valued than big tech, and so are likely to outperform over the next year.
For another bullish perspective, see Why Economic Data Is About To Get Ugly And 3 Things Investors Need To Know, by Dividend Sensei. He notes the robust growth of GDP and of corporate earnings, which can justify a seemingly high price/earnings ratio. The article summary points are:
- Economic data will appear alarming due to hurricane impacts, but the economy is growing at 3% with strong corporate profit prospects and low recession risk.
- Inflation is on track to fall to 1.8% by May, with real wage growth outpacing pre-pandemic trends. Future inflation is expected to remain stable at 2.1% over the next 30 years.
- Market valuation is not as overvalued as feared, with potential for significant upside (up to 30% to 38%) based on corporate profit growth and falling interest rates.
- Short-term market volatility is normal; long-term investors should embrace corrections for potential high returns as fundamentals remain strong.
- The average 2-year return after a 10+% correction is 35%, meaning long-term investors should embrace corrections as wonderful buying opportunities. Buy with confidence in the face of any short-term market weakness, as long as you stick to your optimal personal asset allocation, based on your specific risk profile and financial needs.
This article has a number of interesting and informative sections, including on why cash flow/enterprise value is a better metric for assessing the valuation of a stock than price/earnings.