I don’t like when celebrities are ‘caught’ saying deplorable things in a heated moment. Sometimes they say really awful things, specifically about observables such as race, weight, sex, nationality, odor, etc. Plenty of people have done it. I won’t mention the names or link to any particulars here.
My problem isn’t that I wish celebrities had better behavior – although I do. My problem is with the entire fallout of how we’re all supposed to take the celebrity seriously when they were enraged. When people get angry they say things that are designed to hurt others. People will say things that they don’t mean or wouldn’t normally say. And it’s not like they are betraying some unspoken belief that they’ve hidden. Angry people often say wicked things for the sole purpose of hurting someone else’s feelings. In the moment, the offender tries hard to communicate disrespect – not due to a lack of respect – but due to how it will make the other person feel.
I find the entire circumstance weird. If someone is boiling over and saying patently ridiculous things to me and calling me names, then I have a very hard time taking them seriously. All the same, context matters and words can hurt. It’s weird that we know that people can say untrue things in order to hurt us, and then it actually hurts us. Strange.
The last post where I attempted a macro prescription was in April 2022, when I said the Fed was still under-reacting to inflation. That turned out right; since then the Fed has raised rates a full 500 basis points (5 percentage points) to fight inflation. So I’ll try my luck again here.
Headline annual CPI inflation has fallen from its high of 9% at the peak last year to 3.7% today. Core PCE, the measure more closely watched by the Fed, is at a similar 3.9%. Way better than last year, but still well above the Fed’s target of 2%. Are these set to fall to 2% on the current policy path, or does the Fed still need to do more?
The Fed’s own projections suggest one more rate hike this year, followed by cuts next year. They expect inflation to remain a bit elevated next year (2.5%), and that it will take until 2026 to get all the way back to 2.0%. They expect steady GDP growth with no recession.
What do market-based indicators say? The yield curve is still inverted (usually a signal of recession), though long rates are rising rapidly. The TIPS spread suggests an average inflation rate of 2.18% of the next 5 years, indicating a belief the Fed will get inflation under control fairly quickly. Markets suggest the Fed might not raise rates any more this year, and that if they do it will only be once. All this suggests that the Fed is doing fine, and that a potential recession is a bigger worry than inflation.
Some of my other favorite indicators muddy this picture. The NGDP gap suggests things are running way too hot:
M2 shrank in the last month of data, but has mostly leveled off since May, whereas a year ago it seemed like it could be in for a major drop. I wonder if the Fed’s intervention to stop a banking crisis in the Spring caused this. Judging by the Fed’s balance sheet, their buying in March undid 6 months of tightening, and I think that underestimates its impact (banks will behave more aggressively knowing they could bring their long term Treasuries to the Fed at par, but for the most part they won’t have to actually take the Fed up on the offer).
The level of M2 is still well above its pre-Covid trend:
Before I started looking at all this data, I was getting worried about a recession. Financial markets are down, high rates might start causing more things to break, the UAW strike drags on, student loan repayments are starting, one government shutdown was averted but another one in November seems likely. After looking at the data though, I think inflation is still the bigger worry. People think that monetary policy is tight because interest rates have risen rapidly, but interest rates alone don’t tell you the stance of policy.
I’ll repeat the exercise with the Bernanke version of the Taylor Rule I did in April 2022. Back then, the Fed Funds rate was under 0.5% when the Taylor Rule suggested it should be at 9%- so policy was way too loose. Today, the Taylor Rule (using core PCE and the Fed’s estimate of the output gap) suggests:
3.9% + 0.5*(2.1%-1.8%) + 0.5%*(3.9%-2%) + 2% = 7%
This suggests the Fed is still over 1.5% below where they need to be. Much better than being 9% below like last April, but not good. The Taylor rule isn’t perfect- among other issues it is backward-looking- but it tends to be at least directionally right and I think that’s the case here. Monetary policy is still too easy. Fiscal policy is still way too easy. If current policy continues and we don’t get huge supply shocks, I think a mild “inflationary boom” is more likely than either stagflation or a deflationary recession.
Last weekend I had the opportunity to visit an arcade, but not one of those modern fancy arcades with virtual reality, laser tag, etc. This arcade specializes in having old-school games, primarily pinball, but also early video arcade games. You pay a cover charge ($5 for kids, $10 for adults), and then you use quarters to play the games. But here’s the cool part: the price of the games is the same as it was when the games were first released.
As an economist, of course, I was very interested in the prices.
They had pinball machines that dated back the 1960s, and video games from the late 1970s. Most video arcade games were around 50 cents for the early games (late 1970s and early 1980s). But the pinball machines started out at 25 cents, with the earliest game they had being a Bally Blue Ribbon machine, manufactured in 1965 (interestingly, some of the earlier machines had slots for both dimes and quarters — I assume the price was adjustable mechanically). Notably, you also got to play 5 balls for this price (3 balls seems to be standard later on).
How should we think about that 25 cents? A standard reaction is to adjust the number for inflation. Using the CPI-U as the inflation index, that means the 25 cents from 1965 is “worth” about $2.40 now. That’s interesting, but I don’t think it really provides the relevance that we want today.
An alternative is to calculate the “time price” of playing the game. Using the average hourly wage of $2.67 in December 1965, we can calculate that it would take about 5.5 minutes of work to pay for that game — a game which probably only lasts about 5.5 minutes, unless you are really good at it!
Another comparison we could do is with the cost of video games today compared with wages today. But that’s not really a fair comparison — video games are much more advanced today. We would need to do some sort of quality adjustment, which is overly complicated.
But, at least in my case, there is no need to do the quality adjustment — I can play the exact same game as 1965. In fact, I did (several times). There was also that $10 cover charge that I mentioned, and if I spread that fixed cost over 40 games, it cost me about 50 cents per play (including the 25 cents to start the machine) to play the 1965 Bally’s Blue Ribbon Pinball machine. At the average wage today of $29 per hour, it takes about 1 minute to afford a play of that same game. In other words, my Blue-Ribbon-Pinball standard of living is about 5.5 times greater than in 1965.
Now this isn’t to say we are 5.5 times better off overall than 1965. Prices don’t stay constant for most goods! But hopefully it is a useful way to think about that 25 cent price tag from the past, and how to compare it to today.
I have an oldish Honda that still runs smoothly. It is true that the cruise control does not work, and the left front fender is held on by a large binder clip, and I had to patch over a big rust hole in a rear wheel well, but as I said, it runs.
I sometimes park it down at the end of the street, under some shade trees, to get it out of the hot summer sun. A couple of times, for no reason, the antitheft system kicked on, so the car was honking and honking for hours on end because we didn’t hear it down there. Some neighbors down there finally figured out who it was and came and told us. They were nice about it, but I heard some other folks down there were pretty irritated.
That happened again two weeks ago, so I decided to keep it in front of our house all the time where we could keep an ear on it. Supposedly the alarm is triggered when the car thinks that a door or the trunk or the front hood has been opened without a legitimate unlocking by a key or a fob. Therefore, I opened and closed all four doors, and the trunk and the hood, and locked the car and hoped all will go well. But a few hours later there it was: honk, honk, honk….
As a temporary measure, I simply left it unlocked, so the system would not arm. But that’s not a long-term fix. So, I rolled up my sleeves and went to the internet to see what help I could find there. One common suggestion was to find the fuse that controls the alarm system and just pull it out of the fuse box. That would be great, but I checked multiple fuse diagrams for my model, and it does not seem to be a fuse that controls just the alarm system.
Other web sites mentioned that day sensor on the front hood latch is a common failure point. The sensor there can start giving spurious signals when it gets old. If you are sure that’s the problem, you can have a garage replace it for labor plus maybe 100 bucks for the replacement latch.
Alternatively, you can just pull apart the connector that connects the hood latch sensor to the alarm system. That connection is in plain sight near the latch. If the latch is the problem, disconnecting that sensor should make the alarm system think the latch is always firmly closed, so it will not trigger an armed system.
But what if the hood latch is not a problem? What if the problem is the common but elusive damage to wiring caused by rodents gnawing on the insulation which contains soybean derivatives?? After sifting through about 10 links that were thrown up by my DuckDuckGo search on the subject, I finally found a useful discussion on the “civicsforum.com”.
A certain “andrickjm” wrote that he had disconnected that wire junction, and his car alarm was still randomly going off. Some savant going by the moniker “ezone” wrote that what you needed to do then is to insert a little wire jumper between the two sockets of the connector that go to the alarm system. That will make the alarm system think the hood is always raised, never closed, and this will keep a system from ever arming.
So I cut a 1-inch piece of wire, stripped the insulation from the two ends, bent it into a U-shape, jammed the two bare wire ends into the two holes in the connector socket, and sealed it all up with duct tape.
The alarm has not sounded since. Victory at last, thanks to the distributed intelligence of the internet, resting on the efforts of millions of good-hearted souls who share their problems and solutions in all areas of life.
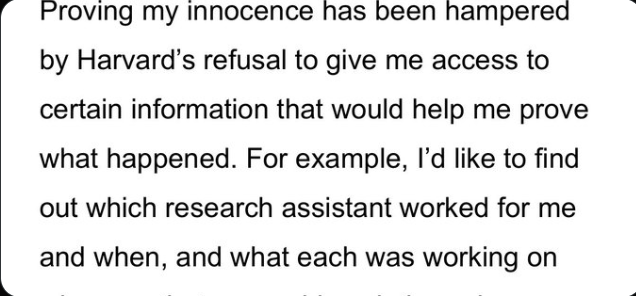
Francesca Gino has been acused of academic fraud. She claims she is innocent. I am not going to adjudicate here whether she committed fraud. What I am going to argue is that she and many other high volume researchers aren’t actually engaged in research. They are grant procurers, managers, high volume writers, globetrotting presenters. But they are not researchers because they are too far removed from the actual production of research. Now, to be clear, that doesn’t necessarily mean the world is worse off. Their comparative advantage may lie in everything from management to carnival barking, but there is a threshold, a degrees-too-far removed from the problem solving at which point you are you no longer a scholar. What that threshold is, I can’t say, but I would argue that if you can’t defend your work, investigate it’s own integrity, if you don’t know who your research assistants are or what they did, then you have likely crossed that thresold. From Gino’s (since updated) website:
We’ve all see the presentations or heard the stories of the leading scholar called on the carpet about something in their project or analysis, only to respond “I’m not sure. My RA did that.” Which is fine. But at some point that started to become assumed as characterizing whole researchers, whole agendas, whole fields. There are always going to be the prodigiously productive, but those people used to be one or two in a generation. Glorious anomalies. Universities are now littered with faculty with hundreds of publications, sometimes dozens in a single year, and we all know that it is physically impossible for them to conduct that work themselves. Gino received her PhD in 2004 and in the 19 years since has 460 (!!!) publications listed on google scholar. Some of those are probably duplicate listings, but it’s probably safe to say she has more than 20 publications per year for 20 years. It’s hard enough to imagine having energy enough to write and present that many papers even if they are produced entirely by others. This is not unique to Gino and thereis no doubting the prodigious work ethic in evidence within her and others. What is in question is whether the ever raising bar on output is lowering the quality of work done by the field as a whole. It’s a tax on us all if research concentrated within the labor of the most qualified, competent, and creative no longer produces an acceptable return to scale. Some people really are better managers of other people’s work, at some point the work has to be attributable to one or more people. Who is doing the work? Who is responsible for the work?
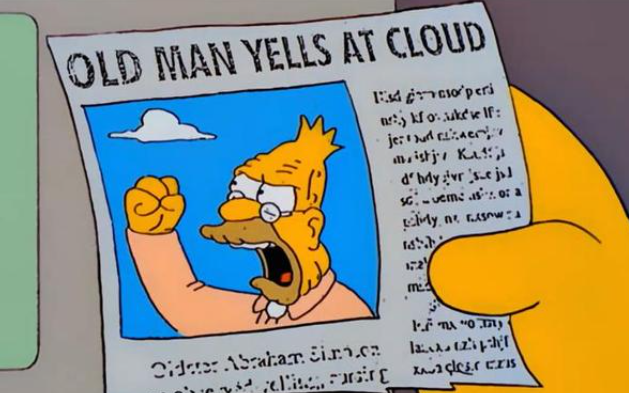
Maybe this isn’t really useful and I don’t feel like yelling at clouds for 5000 words. As I was saying…
But I’ll tell you this- truly great researchers work with other greater researchers, employ smart people, mentor promising RAs. And they know who they are and what they did. Because when you’re in the weeds trying to answer questions, its almost impossible not to know. That doesn’t mean mistakes won’t be made and errors overlooked. But when it comes time to audit your work, you’ll know where to start and what might have gone wrong. If you don’t know, well, maybe you’re lying, but maybe more likely you just weren’t around when the work was getting done. You were promoting your last project and getting your next grant. Because you’re not a researcher. At least not anymore.
You’re a manager, promoter, figurehead, pitchman, traveling roadshow. You’re likely useful and valuable. Publication and Grant, LLC.
But you’re not a scholar. And the institutions employing you aren’t producing scholarship. These faculty are following their incentives, and those incentives are at the moment treating research as a game to be played. Not science. Not the answering of questions. An expensive hustle to grind and empty race to win. They’re getting what they’re paying (and tenuring) for.
Joy: This post was written by my friend and fellow econ professor Cameron Hardwick.
One of my biggest ongoing teaching challenges is keeping students engaged during lectures.
Sure, there are ways to add interactivity here and there, but sometimes there’s just no way around an old-fashioned lecture.
There are a few ways of dealing with this, and I haven’t been satisfied with any.
It’s their grade, if they zone out that’s on them. In terms of the incentives, sure, the externalities are all internalized. But as a macroeconomist, I also know: if time-inconsistency problems are hard for policymakers, how much more for students! We shouldn’t be surprised when students do poorly if the main feedback they get from paying attention or not comes a week later with the homework grade.
Posing questions and waiting for answers. Either you get a minute of awkward silence, or you get the same two engaged students answering everything while everyone else keeps zoning out.
Cold calling. I started doing this a few years into teaching. The advantage is that it keeps students on their toes and paying attention. But a few problems left me unsatisfied:
“How about you in the red shirt”. Hard to catch a student’s attention that way, and in a class of 40 or more, learning names takes a good chunk of the semester.
I had no systematic way of keeping track of participation. Every semester I’d look at the roster and still have a few names I couldn’t put a face to.
Humans are really bad at making random choices! Much as I tried, I couldn’t guarantee I wasn’t biased toward or against (say) the corners of the room, or students whose names I knew.
LMS software. These can offer a lot of great student participation tools. But students have to pay for them – which isn’t worth it if you’re just looking for one feature. On top of that, then you’re locked into an ecosystem.
So, I made an app myself. It does one thing and does it well.
Pick.al (pronounced Pickle) picks students at random from a roster and keeps track of participation points. I can now pose a question in class, ask “what do you think…”, pull out my phone and hit a button, and have a name.
I can also record the quality of their answers:
✓: 1 point, good attempt! (Since this is for participation points, I record ✓ whether right or wrong, as long as they give it a good shot)
?: 0.5 points, if they ask “wait, what was the question?”
×: 0 points, if they’re not there or don’t respond at all.
There’s also a 1-5 scale option, for those who want a more fine-grained evaluation.
This has a lot of benefits in the classroom:
Since I can call on students by name, I learn names more quickly.
Pick.al chooses randomly from the pool of students who have been called on the least so far. So, I know my participation points are as fair as possible.
Students know they can get called on at any time, so they pay attention more in class, and then do better on the homeworks and tests.
Students appreciate being brought in more frequently. One noted on the evaluations the first semester I piloted it: “something specific I like is he got the class involved by calling people out which forced them to test their knowledge which is something teachers need to do more of.”
Using Pick.al is as simple as registering (with an email address or an OrcID), uploading a roster, and then hitting a button during class. You can also swipe through the history and edit or undo participation events, and go back in the admin interface and add, edit, and remove participation events after the fact if necessary.
Pick.al is secure and password-protected, and has a number of handy features:
You can set excused absences if a student lets you know beforehand, so their name doesn’t come up until a certain date.
You can select specific students from the roster in a sidebar, if you want to give credit to – say – a student who raises his hand unbidden.
If you’d like to use the classroom computer instead of pulling out a phone, you can use it with full keyboard navigation.
Scores can be downloaded as a CSV to be put in your own gradebook.
Private notes can be added to students to show up when their names are selected, e.g. “sits in the back corner”
If you use it and find a bug or have an idea that would make it more useful to you, feel free to let me know. It’s been a great tool in my own classes, and I hope it’ll be useful for other teachers to keep students engaged too.
It’s been almost a decade since I taught principles of economics classes. One major allocation of my time this semester is course prep, since I am teaching 3 different classes.
For my Principles of Microeconomics course, I chose Modern Principles of Economics, because I figured Tyler and Alex had done a good job and I have heard good reviews from others.
I’m writing a short review of their instructor resources, and then I’ll have to get back to course prep.
Like most textbooks, they provide you with slides that you can modify. Not having to start from scratch on lecture slides is great.
They also have teacher guides for each chapter. I find these helpful, because I have not taught this class in many years. Even though “I’m an economist,” there is still a technique to presenting these ideas for the first time to undergraduates. No need to re-invent that wheel completely.
They have suggestions for in-class activities. For example, to illustrate demand shifts, ask the students about a recent celebrity scandal and how that created a fall in the demand for concert tickets. It works. Everyone loves talking about celebrity scandals. It will be an evergreen idea. There are always new scandals for each semester – the students know more about it than the professors. My students (Fall 2023) informed me that Lizzo got in hot water for fat-shaming.
Their online learning platform called Achieve within MacMillan works well. It integrates really well with Canvas, our LMS. One warning I would give you is to make sure that students buy Achieve through an account on their .edu email address. I have headaches over students signing up with a personal email address and then not having their data integrate with Canvas.
You can sign up for EconInbox, which will email you topical relevant news stories right before you would want to present them in class. You’ll have to tell them ahead of time what your schedule of topics is, but that is something you ought to have worked out in your syllabus at the beginning of the semester. Obviously, you can’t cover every chapter in one semester. There are far more resources, generally, than you can use. But picking and choosing from a great library is easier than trying to build something from scratch yourself.
Lastly, the Cowen Tabarrok textbook integrates nicely with the free Marginal Revolution University video library. MRU is free to all. So, as an instructor you could still use it heavily even if you are not assigning their textbook or even if you are not doing Achieve. Still, I think that making use of the MRU resource is easiest if you are using their textbook. A fun video that might even be worth using class time for is Avengers: The Story of Globalization
Many households are now 2-income households. And that can make parenting a slog.
You go to work for 8-10 hours, you may or may not need to provide transportation for children to/from school, and child-care can eat a substantial portion of income. If the children are small, then the parents clean the floors, the dishes, and the clothes. Not to mention any home improvements or repairs. And food! Do you want to eat a home-cooked meal as a family? If both parents work typical hours, then prepare to eat no earlier than 6 PM, and maybe as late as 7:30.
Hey but there’s the weekend, right? NOPE! Someone has to do that big weekly shopping trip. How long is that going to take? The whole ordeal is enough to make someone think twice before having that 2nd kid. After all, if one kid getting sick throws a wrench in even a single day’s routine, then the whole week can be affected. How many sick kids before things stop getting done? Having a grandparent around to help would be a huge privilege and blessing.
At this point, I think that I can begin to call myself an experienced parent. I’ve got 4 kids who are ages 6 and younger. Plenty of modern conveniences make life easier. Many groceries can be purchased ahead of time for ‘order pick-up’ or online for delivery. Nice. Books are super cheap, and so are bubbles and drawing supplies. If I have to get some work/chores done while the kids are awake, then I can buy myself some time. But, like it or not, when the kids are asleep in the evening is when most chores will get done.
Regular readers will know that we love not only economics, but also history and data. We especially love it when “data heroes” take data that was difficult or impossible to access and make it easily available to everyone. The Federal Reserve Bank of Philadelphia just announced a project that brings together all of these things we love, their new Center for the Restoration of Economic Data:
Our mission is to advance research in topics related to regional economics and consumer finance by making economic data available in readily accessible, digital form. CREED combines state-of-the-art machine learning technology with deep subject matter expertise to convert natively unstructured data (information in books, images, and other undigitized formats) into readily accessible digital data.
The CREED research team shares the original analog or unstructured data as well as the code used to recover and clean these data, which are aggregated for use in novel economic research. Our collection features volumes of old, often overlooked, and frequently inaccessible data, which have been mined, restored, and converted into unstructured digital and analytically usable formats.
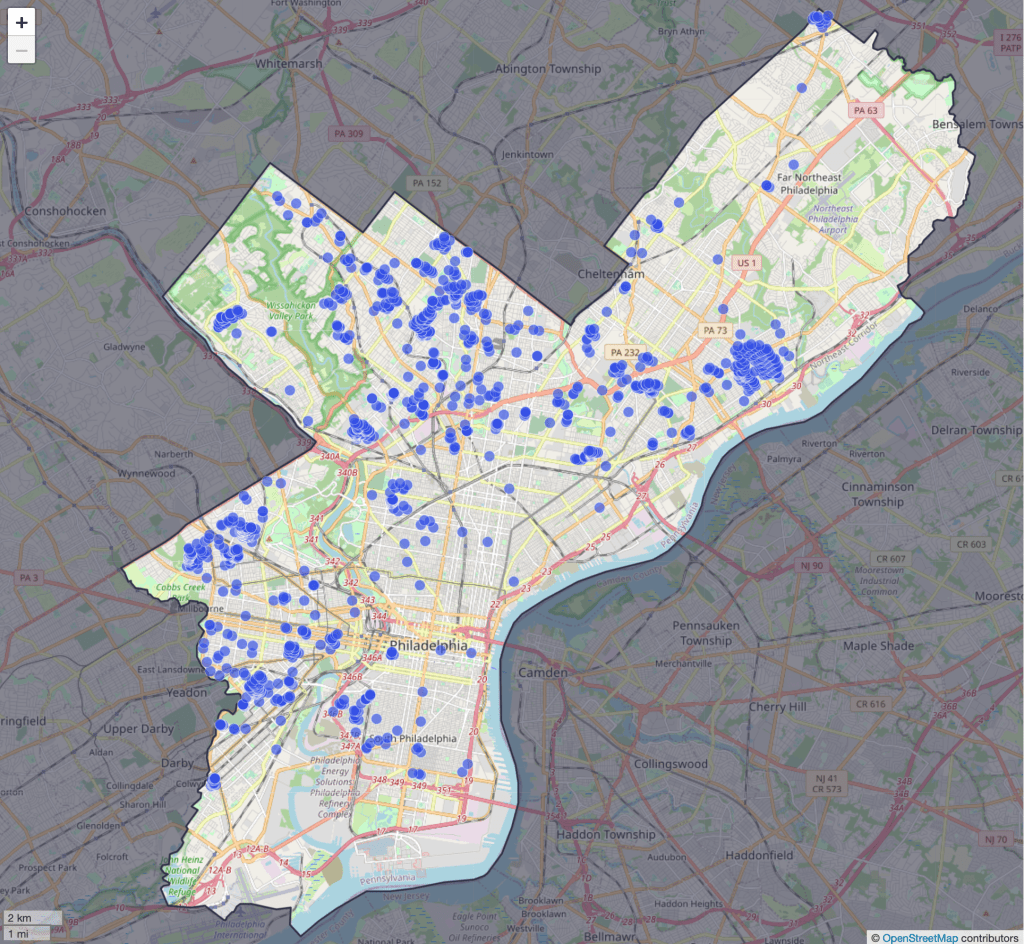
Their first project is to map all of the racially restrictive covenants in the city of Philadelphia. Until the U.S. Supreme Court declared such covenants to be unenforceable in 1948, they often barred properties from being sold to non-whites or non-citizens. After 1948 redlining took different forms, some of which may still persist today.
CREED shares the underlying data used to build the map here, and they say much more is one the way. I love it when economic historians (and regular historians) digitize old paper records and share the resulting data, and hope to see more examples like this to share in the coming years.
Disclaimer: I am a visiting scholar at the Federal Reserve Bank of Philadelphia but I was not involved with this project
The Federal Reserve has released the latest update to their Distributional Financial Accounts data, which the data underlying several of my past posts on generational wealth. With that recent data, I have updated the chart of wealth for Baby Boomers, Generation X, and Millennials.
The data is shown on a log scale to better show growth rates and allow for easier visual comparisons. But if you are interested in the more precise numbers, in the most recent quarter (2023q2) Generation X has, on average about $620,000 in net wealth, which compares favorably with Baby Boomers at about the same age (in 2006) with about $539,000 in net wealth per person. That’s about 20 percent more.
Millennials have about $115,000 in net wealth on average, which also compares favorably with Baby Boomers, who had slightly more at about the same age (in 1990) with $121,000 in net wealth on average. Given the uncertainties of all the data that goes into this, I’d say those are roughly equal. Gen X had a bit more around the same age (in 2007) with $149,000, but that fell significantly the next two years during the Great Recession.
(For more detail on my approach to creating the chart, see the linked post above, but in short I’m using the Fed DFA data for wealth, Census Bureau data by single year of age for population, and the Personal Consumption Expenditures price index for inflation adjustments (I also have a chart with the CPI-U — it’s not much different). Wealth data is for the 2nd quarter in each year (to match 2023), except for 1989 since the 3rd quarter is the first available.)
Given how much wealth can fluctuate based on housing values (see above for Gen X from 2007-2009), it might be useful to look at the data with housing. Housing is also a weird kind of wealth — for the most part, you can’t access it without selling (other than certain home equity loans), and when you do sell, unless your home appreciated more than average, you just have to move to another home that also appreciated.
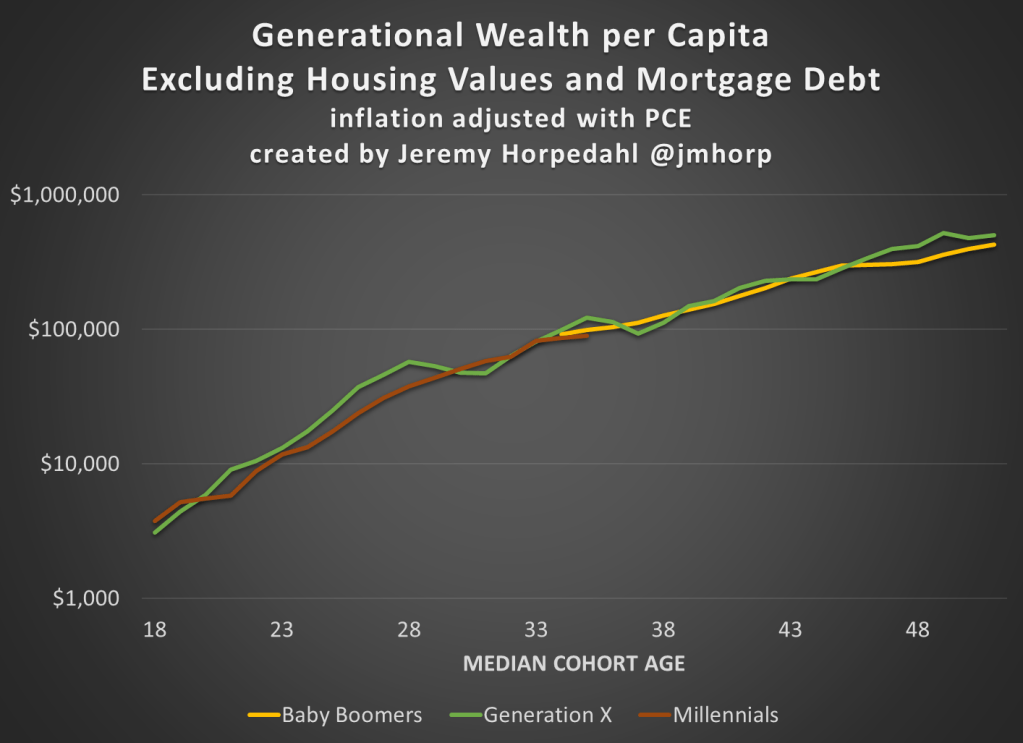
Here’s the chart excluding housing value and mortgage debt:
The chart… doesn’t change much. The values are all lower, of course, but the comparisons across generations look pretty similar. Gen X right now is 17 percent wealthier than Boomers at the same age. And if we look at all three generations around the median age of 35, they are pretty close: Gen X with $123,000 (but slipping over the next few years), Boomers with $99,000, and Millennials with $90,000.