After raising rates in 2022 to belatedly combat inflation, the FOMC was feeling successful in 2024. They were holding the line and remaining steadfast while many people were getting all in a tizzy about pushing us into a recession. People had been predicting a recession since 2022, and the Fed kept the federal funds rate steady at 5.33% for an entire year. Repeatedly, in the first half of 2024, betting markets were upset that the Fed wasn’t budging. I had friends saying that the time to cut was in 2023 once they saw that Silicon Valley Bank failed. I remained sanguine that rates should not be cut.
I thought that rates should have been higher still given that the labor market was strong. But, I also didn’t think that was going to happen. My forecasts were that the Fed would continue to keep rates unchanged. At 5.33%, inflation would slowly fall and there was plenty of wiggle room for unemployment.
Then, we had a few months of lower inflation. It even went slightly negative in June 2024. Some people were starting to talk about overshooting and the impending recession. I documented my position in August of 2024. Two weeks later, Jerome Powell gave a victory lap of a speech. He said that “The time has come for policy to adjust”. Instead of discerning whether the FOMC would cut rates, the betting markets switched to specifying whether the cut would be 0.25% or 0.5%. The Fed chose the latter, followed by two more cuts by the end of the year.
I was wrong about the Fed’s policy response function. But why? Was the FOMC worried about the downward employment revisions? That was big news. Did they think that they had inflation whipped? I’m not sure. There was a lot of buzz about having stuck the soft landing. In late 2024, I leaned toward the theory that the Fed was concerned about employment. Like, they thought that we had been doing better until then.
Despite its many flaws*, I always like to checkinon what the Taylor Rule suggests for the Fed. Its virtues are that it gives a definite precise answer, and that it has been agreed upon ahead of time by a variety of economists as giving a decent answer for what the Fed should do. Without something like the Taylor Rule, everyone tends to grasp for reasons that This Time Is Different. Academics seek novelty, so would rather come up with some new complex new theory of what to do instead of something undergrads have been taught for years. Finance types tend to push whatever would benefit them in the short term, which is typically rate cuts. Political types push whatever benefits their party; typically rate cuts if they are in power and hikes if not, though often those in power simply want to emphasize good economic news while those out of power emphasize the bad news.
The Taylor Rule can cut through all this by considering the same factors every time, regardless of whether it makes you look clever, helps your party, or helps your returns this quarter. So what is it saying now? It recommends a 6.05% Fed funds rate:
Fed Funds Rate Suggested by the Bernanke Version of the Taylor Rule Source: My calculation using FRED data, continually updated here
I continue to use the Bernanke version of the Taylor Rule, which says that the Fed Funds rate should be equal to:
Core PCE + Output Gap + 0.5*(Core PCE – 2) +2
*What are the flaws of the Taylor Rule? It sees interest rates as the main instrument of monetary policy; it relies on the Output Gap, which can only really be guessed at; and it incorporates no measures of expectations. If I were coming up with my own rule I would probably replace the Output Gap with a labor market measure like unemployment, and add measures of money supply shifts and inflation expectations. Perhaps someday I will, but like everyone else I would naturally be tempted to overfit it to the concerns of the moment; I like that the Taylor Rule was developed at a time when Taylor had no idea what it might mean for, say, the 2024 election or the Q3 2024 returns of any particular hedge fund.
That said, people have now created enough different versions of the Taylor Rule that they can produce quite a range of answers, undermining one of its main virtues. The Atlanta Fed maintains a site that calculates 3 alternative versions of the rule, and makes it easy for you to create even more alternatives:
Two of their rules suggest that Fed Funds should currently be about 4%, implying a major cut at a time that the Bernanke version of the rule suggests a rate hike. On the other other hand, perhaps this variety is a virtue in that it accurately indicates that the current best path is not obvious; and the true signal comes in times like late 2021 when essentially every version of the rule is screaming that the Fed is way off target.
I’m not using all of it, but it’s very helpful to see what other instructors have come up with to make teaching monetary policy more fun and more effective. You have to sign up to access it, using your official instructor email address.
It can feel relatively easy to talk to students about their role in the economy as consumers. It is relatively hard to lecture about central banking, because it is less relatable to everyday life. These exercises help us get into the “mind” of a bank.
Thank you to Econiful and Marginal Revolution University for making these resources available. There will probably be an equivalent for fiscal policy produced in the future.
Everyone else keeps asking when the Fed will cut rates, and yesterday Chair Powell said they will likely cut this year. Either they are all crazy or I am, because almost every indicator I see indicates we are still above the Fed’s inflation target of 2% and are likely to remain there without some change in policy. Ideally that change would be a tightening of fiscal policy, but since there’s no way Congress substantially cuts the deficit this year, responsibility falls to the Federal Reserve.
Lets start with the direct measures of inflation: CPI is up 3.1% from a year ago. The Fed’s preferred measure, PCE, is up 2.4% from a year ago. Core PCE, which is more predictive of where inflation will be going forward, is up 2.8% over the past year. The TIPS spread indicates 2.4% annualized inflation over the next 5 years. The Fed’s own projections say that PCE and Core PCE won’t be back to 2.0% until 2026.
The labor market remains quite tight: the unemployment rate is 3.7%, payroll growth is strong (353,000 in January), and there are still substantially more job openings than there are unemployed workers. The chattering classes underrate this because they are in some of the few sectors, like software and journalism, where layoffs are actually rising. Real GDP growth is strong (3.2% last quarter), and nominal GDP growth is still well above its long-run trend, which is inflationary.
I do see a few contrary indicators: M2 is still down from a year ago (though only 1.4%, and it is up over the past 6 months). The Fed’s balance sheet continues to shrink, though it is still trillions above the pre-Covid level. Productivity rose 3.2% last quarter.
At least over the past year I think fiscal policy is more responsible than monetary policy for persistent inflation. But I can’t see Congress doing a deficit-reducing grand bargain in an election year; the CBO projects the deficit will continue to run over 5% of GDP. That means our best chance for inflation to hit the target this year is for the Fed to tighten, or at least to not cut rates. If policy continues on its current inflationary path, our main hope is for a deus-ex-machina like a true tech-fueled productivity boom, or deflationary events abroad (recession in China?) lowering prices here.
The last post where I attempted a macro prescription was in April 2022, when I said the Fed was still under-reacting to inflation. That turned out right; since then the Fed has raised rates a full 500 basis points (5 percentage points) to fight inflation. So I’ll try my luck again here.
Headline annual CPI inflation has fallen from its high of 9% at the peak last year to 3.7% today. Core PCE, the measure more closely watched by the Fed, is at a similar 3.9%. Way better than last year, but still well above the Fed’s target of 2%. Are these set to fall to 2% on the current policy path, or does the Fed still need to do more?
The Fed’s own projections suggest one more rate hike this year, followed by cuts next year. They expect inflation to remain a bit elevated next year (2.5%), and that it will take until 2026 to get all the way back to 2.0%. They expect steady GDP growth with no recession.
What do market-based indicators say? The yield curve is still inverted (usually a signal of recession), though long rates are rising rapidly. The TIPS spread suggests an average inflation rate of 2.18% of the next 5 years, indicating a belief the Fed will get inflation under control fairly quickly. Markets suggest the Fed might not raise rates any more this year, and that if they do it will only be once. All this suggests that the Fed is doing fine, and that a potential recession is a bigger worry than inflation.
Some of my other favorite indicators muddy this picture. The NGDP gap suggests things are running way too hot:
M2 shrank in the last month of data, but has mostly leveled off since May, whereas a year ago it seemed like it could be in for a major drop. I wonder if the Fed’s intervention to stop a banking crisis in the Spring caused this. Judging by the Fed’s balance sheet, their buying in March undid 6 months of tightening, and I think that underestimates its impact (banks will behave more aggressively knowing they could bring their long term Treasuries to the Fed at par, but for the most part they won’t have to actually take the Fed up on the offer).
The level of M2 is still well above its pre-Covid trend:
Before I started looking at all this data, I was getting worried about a recession. Financial markets are down, high rates might start causing more things to break, the UAW strike drags on, student loan repayments are starting, one government shutdown was averted but another one in November seems likely. After looking at the data though, I think inflation is still the bigger worry. People think that monetary policy is tight because interest rates have risen rapidly, but interest rates alone don’t tell you the stance of policy.
I’ll repeat the exercise with the Bernanke version of the Taylor Rule I did in April 2022. Back then, the Fed Funds rate was under 0.5% when the Taylor Rule suggested it should be at 9%- so policy was way too loose. Today, the Taylor Rule (using core PCE and the Fed’s estimate of the output gap) suggests:
3.9% + 0.5*(2.1%-1.8%) + 0.5%*(3.9%-2%) + 2% = 7%
This suggests the Fed is still over 1.5% below where they need to be. Much better than being 9% below like last April, but not good. The Taylor rule isn’t perfect- among other issues it is backward-looking- but it tends to be at least directionally right and I think that’s the case here. Monetary policy is still too easy. Fiscal policy is still way too easy. If current policy continues and we don’t get huge supply shocks, I think a mild “inflationary boom” is more likely than either stagflation or a deflationary recession.
Inflation is definitely here. The latest CPI release puts the annual inflation rate in the US at 8.5% over the past 12 months, the highest 12-month period since May 1981. That’s bad, especially because wages for many workers aren’t keeping up with the price increases (and that’s true in other countries too).
But what about other countries? Many countries are experiencing record inflation too. The same day the US announced the latest CPI data, Germany announced that they also had the highest annual inflation since 1981.
Using data from the OECD, we can make some comparisons across countries during the pandemic. I’ll use data through February 2022, which excludes the most recent (very high!) months for places like the US and Germany, but most countries haven’t released March 2022 data quite yet.
Let’s compare inflation rates and GDP growth (in real terms, also from the OECD), using the end of 2019 as a baseline. We’ll compare the US, the other G-7 countries, and several broad groups of countries (OECD, OECD European countries, and the Euro area). The chart below uses “core inflation,” which excludes food and energy (below I will use total inflation — the basic picture doesn’t change much).
I am not worried about inflation and I’m not worried about the total spending in the economy. As I’ve said previously, total spending is on track with the pre-pandemic trend and, I think, that helped us experience the briefest recession in US history. When output growth declines below trend, we face higher prices or lower incomes. The former causes inflation, the latter causes large-scale defaults. Looking at the historical record, I’m for more concerned about the latter.
I do, however, want to call special attention to the composition of the Fed’s balance sheets. Specifically, its Mortgage Backed Security (MBS) assets. Having learned from the 2008 recession, the Fed was very intent on maintaining a stable and liquid housing market. Purchasing MBS is one way that it maintained that stability. Its total MBS holdings almost doubled from March of 2020 to December of 2021 to $2.6 trillion. Should we be concerned?
At first, a doubling sounds scary. And, anything with the word ‘trillion’ is also scary. Even the graph below looks a little scary. MBS holdings by the Fed jumped and have continued to increase at about a constant rate. Is the housing market just being supported by government financing? What happens when the Fed decides to exit the market?
Luckily for us, there is precedent for Fed MBS tapering. The graph below is in log units and reflects that a similar acceleration in MBS purchases occurred in 2013. Fed net purchases were practically zero by 2015 and total MBS assets owned by the Fed were even falling by 2018. Do you remember the recession that we had in 2013 when the Fed stopped buying more MBS’s? Wasn’t 2018-2019 a rough time for the economy when the Fed started reducing its MBS holdings? No. We experienced a recession in neither 2013 nor 2018. Financial stress was low and RGDP growth was unexceptional.
Although there was no macroeconomic disruption, what about the residential sector performance during those times? Here is a worrisome proposed chain of causation:
Relative to a heavier MBS balance sheet, the Fed reducing its holdings increases supply on the MBS market.
This means that the return on creating new MBS’s falls (the price rises).
A lower return on MBS’s means that there is less demand from the financial sector for new loans from loan originators.
A tighter secondary market for mortgages decreases the eagerness with which banks lend to individuals.
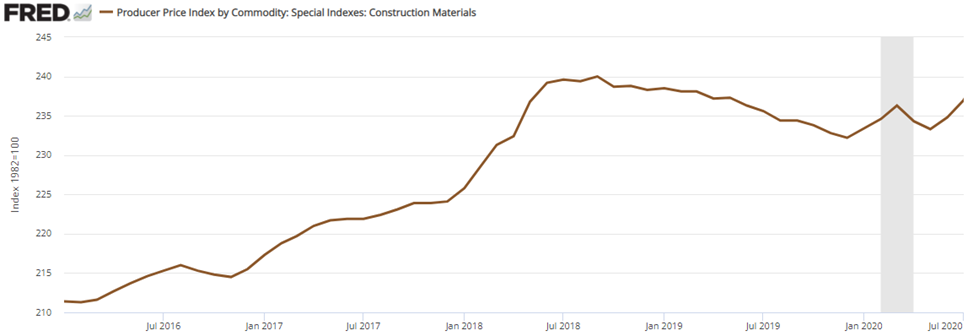
Fewer loans to individuals puts downward pressure on the demand for houses and on the price of the associated construction materials.
The data fits this story, but without major disruption.
Less eager lenders went hand-in-hand with higher mortgage rates and less residential construction spending. The substitution effect pushed more real-estate lending and spending to the commercial side. Whereas residential spending was almost the same in late 2019 as it was in early 2018, commercial real-estate spending rose 13% over the same time period.
But, importantly in the story, the income effect of a Fed disruption should have been negative, resulting in less total spending and lower construction material prices. And that’s not what happened. Total Construction spending rose and so did construction material prices. Both of these are the opposite of what we would expect if the Fed had caused disruption in the housing construction sector due to its MBS holding changes. Spending on residential construction fell understandably. But spending on commercial construction and the price of construction materials rose.
My point is that you should not listen to the hysteria.
The Fed has a variety of assets on its balance sheet and it pays special attention to the residential construction sector. Do you think that there is a residential asset bubble? Ok. Now you have to address whether the high prices are due to demand or supply. Do you suspect that the Fed unloading its MBS’s will result a popped bubble and maybe even contagion? It’s ok – you’re allowed to think that. But the most recent example of the Fed doing that didn’t result in either a macroeconomic crisis or substantial disruption in the construction markets.
The Fed has a track record and it has a reputation that serves as valuable information concerning its current and prospective activities. The next time that someone gets hysterical about Fed involvement in the housing sector, ask them what happened last time? Odds are that they don’t know. Maybe that information doesn’t matter for their opinion. You should value their opinion accordingly.
The latest CPI inflation data was released this morning. Mostly the new data just confirms what we’ve seen the past few months: consumer price inflation is at the highest levels in decades, and it is now very broad based.
To see how broad based the inflation is, we can look at any of the “special aggregates” that the BLS produces. CPI less food. CPI less shelter. CPI less food, shelter, energy, used cars and trucks (what a mouthful!). All of these are up substantially over the past year. The lowest number you can get is that last aggregate I listed, which excludes almost 60% of consumer spending, and even it is up 4.7% over the past year — the largest increase since 1991 for that particular special index.
Or, you can just look at food. We all have probably observed that meat prices are way up recently — about 15% over the past year. But it’s not just meat. It’s fruit, vegetables, grains, dairy… the whole darn food pyramid. In fact, there are only two food categories (hot dogs and cheese) and two drinks (tea and wine) that are actually down since December 2020.
The only categories of food and drinks in the CPI that are down since last year are hot dogs, cheese, tea, and wine
— Jeremy 'adjusted for inflation' Horpedahl 📈 (@jmhorp) January 12, 2022
I’ve covered the symbolic importance of hot dog prices before, but the fact that only four food or drink categories had price decreases are indications that food-price inflation is extremely broad-based.
I remember people talking about Covid-19 in January of 2020. There had been several epidemic scare-claims from major news outlets in the decade prior and those all turned out to be nothing. So, I was not excited about this one. By the end of the month, I saw people making substantiated claims and I started to suspect that my low-information heuristic might not perform well.
People are different. We have different degrees of excitability, different risk tolerances, and different biases. At the start of the pandemic, these differences were on full display between political figures and their parties, and among the state and municipal governments. There were a lot of divergent beliefs about the world. Depending on your news outlet of choice, you probably think that some politicians and bureaucrats acted with either malice or incompetence.
I think that the Federal Reserve did a fine job, however. What follows is an abridged timeline, graph by graph, of how and when the Fed managed monetary policy during the Covid-19 pandemic.
February, 2020: Financial Markets recognize a big problem
The S&P begins its rapid decent on February 20th and would ultimately lose a third of its value by March 23rd. Financial markets are often easily scared, however. The primary tool that the Fed has is adjusting the number of reserves and the available money supply by purchasing various assets. The Fed didn’t begin buying extra assets of any kind until mid-March. There is a clear response by the 18th, though they may have started making a change by the 11th. One might argue that they cut the federal funds rate as early as the 4th, but given that there was no change in their balance sheet, this was probably demand driven.
March, 2020: The Fed Accommodates quickly and substantially.
In the month following March 9th, the Fed increased M2 by 8.3%. By the week of March 21st, consumer sentiment and mobility was down and economic policy uncertainty began to rise substantially – people freaked out. Although the consumer sentiment weekly indicator was back within the range of normal by the end of April, EPU remained elevated through May of 2020. Additionally, although lending was only slightly down, bank reserves increased 71% from February to April. Much of that was due to Fed asset purchases. But there was also a healthy chunk that was due to consumer spending tanking by 20% over the same period.
In the 18 months prior to 2020, M2 had grown at rate of about 0.5% per month. For the almost 18 months following the sudden 8.3% increase, the new growth rate of M2 almost doubled to about 1% per month. The Fed accommodated quite quickly in March.
April, 2020: People are awash with money
Falling consumption caused bank deposit balances to rise by 5.6% between March 11th and April 8th. The first round of stimulus checks were deposited during the weekend of April 11th. That contributed to bank deposits rising by another 6.7% by May 13th.
By the end of March, three weeks after it began increasing M2, the Fed remembered that it really didn’t want another housing crisis. It didn’t want another round of fire sales, bank failures, disintermediation, collapsed lending, and debt deflation. It went from owning $0 in mortgage-backed securities (MBS) on March 25th to owning nearly $1.5 billion worth by the week of April 1st. Nobody’s talking about it, but the Fed kept buying MBS at a constant growth rate through 2021.
May, 2020 – December, 2021: The Fed Prevents Last-Time’s Crisis
Jerome Powell presided over the shortest US recession ever on record. The Fed helped to successfully avoid a housing collapse, disintermediation, and debt deflation – by 2008 standards. The monthly supply of housing collapsed, but it had bottomed out by the end of the summer. By August of 2021, the supply of housing had entirely recovered. The average price of new house sales never fell. Prices in April of 2020 were typical of the year prior, then rose thereafter. A broader measure of success was that total loans did not fall sharply and are nearly back to their pre-pandemic volumes. After 2008, it took six years to again reach the prior peak. A broader measure still, total spending in the US economy is back to the level predicted by the pre-pandemic trend.
The Fed can’t control long-run output. As I’ve written previously, insofar as aggregate demand management is concerned, we are perfectly on track. The problem in the US economy now is real output. The Fed avoided debt deflation, but it can’t control the real responses in production, supply chains, and labor markets that were disrupted by Covid-19 and the associated policy responses.
What was the cost of the Fed’s apparent success? Some have argued that the Fed has lost some of its political insulation and that it unnecessarily and imprudently over-reached into non-monetary areas. Maybe future Fed responses will depend on who is in office or will depend on which group of favored interests need help. Personally, I’m not so worried about political exposure. But I am quite worried about the Fed’s interventions in particular markets, such as MBS, and how/whether they will divest responsibly.
Of course, another cost of the Fed’s policies has been higher inflation. During the 17 months prior to the pandemic, inflation was 0.125% per month. During the pandemic recession, consumer prices dipped and inflation was moderate through November. But, in the 16 months since April of 2020, consumer prices have grown at a rate of 0.393% per month – more than three times the previous rate. Some of that is catch-up after the brief fall in prices.
Although people are genuinely worried about inflation, they were also worried about if after the 2008 recession and it never came. This time, inflation is actually elevated. But people were complaining about inflation before it was ever perceptible. The compound annual rate of inflation rose to 7% in March of 2021. But it had been almost zero as recent as November, 2020. That March 2021 number is misleading. The actual change in prices from February to March was 0.567%. Something that was priced at $10 in February was then priced at $10.06 in March. Hardly noticeable, were it not for headlines and news feeds.