Last January I shared a roundup of forecasts for the year from markets and professional economists. Were they any good? Here was their prediction for the US economy:
WSJ’s survey of economists reports that inflation expectations for 2025 were around 2% before the election, but are closer to 3% now. Their economists expect GDP growth slowing to 2%, unemployment ticking up slightly but staying in the low 4% range, with no recession. The basic message that 2025 will be a typical year for the US macroeconomy, but with inflation being slightly elevated, perhaps due to tariffs.
The verdicts (based on current data, which isn’t yet final for all of 2025):
Inflation: Nailed it exactly (2.7%)
GDP: We’re still waiting on Q4, but 2025 as a whole is on track to be a bit above the 2.0% forecast.
Unemployment: 4.6% as of November 2025, a bit above the 4.3% forecast
Recession: Didn’t happen, making the 22% chance forecast look fine
So the professional forecasters were probably a bit low on GDP and unemployment, but overall I’d say they had a good year. What about prediction markets?
For those who hope for DOGE to eliminate trillions in waste, or those who fear brutal austerity, the message from markets is that the huge deficits will continue, with the federal debt likely climbing to over $38 trillion by the end of the year. This is one reason markets see a 40% chance that the US credit rating gets downgraded this year.
While the US has only a 22% chance of a recession, China is currently at 48%, Britain at 80%, and Germany at 91%. The Fed probably cuts rates twice to around 4.0%.
Deficits: Nailed it, the federal debt is currently around $38.4 trillion.
US Credit Downgrade: It’s hard to score a prediction of a 40% chance of a binary event happening, but in any case Moodys downgraded the US’ credit rating in May, so that all three major agencies now rate it as not perfect.
The Fed: Cut rates a bit more than expected.
Foreign Recessions: China and Britain avoided recessions. Germany had a recession by the technical definition of Kalshi’s market, but not really in practice (FRED shows -0.2% Real GDP growth in Q2 followed by 0.00000% growth in Q3). Britain avoiding recession when markets showed an 80% chance was the biggest miss among the forecasts I highlighted.
Overall though, I’d say forecasters did fairly well in predicting how 2025 turned out, in spite of curveballs like the April tariff shock.
If you think the forecasters are no good and you can do better, you have more options than ever. Prediction markets are getting more questions and more liquidity if you’re up for putting your money where your mouth is; if you don’t want to put your own money at risk, there are forecastingcontests with prizes for predicting 2026.
Yesterday I showed that BLS jobs reports from the CES aren’t getting worse over time, if we judge them by how much they are later revised. In fact, they are much better than decades past, with the last 20 years or so standing out as much better than the past.
Today I want to address a related but separate topic: are the initial jobs reports good at telling us when a downturn in the labor market is beginning? This is actually the strongest argument for releasing this survey data in a timely manner, even though the data often goes through significant revisions later. The report typically comes out the first Friday of a new month, so it is very current data. Given that the likely new BLS Commissioner has signaled he prefers the more accurate quarterly release, even though it is 7-9 months after the fact, it is useful to ask if these initial reports have any value in telling us when labor market declines (and recessions) are beginning.
That’s right: you are getting two posts from me this week, on essentially the same topic. Because it’s very important right now.
The short answer: the report is very good for the purpose of identifying downturns, especially the start of the downturns. Let’s walk through the past few recessions.
WSJ’s survey of economists reports that inflation expectations for 2025 were around 2% before the election, but are closer to 3% now. Their economists expect GDP growth slowing to 2%, unemployment ticking up slightly but staying in the low 4% range, with no recession. The basic message that 2025 will be a typical year for the US macroeconomy, but with inflation being slightly elevated, perhaps due to tariffs.
Kalshi has a lot of good markets up that give more detailed predictions for 2025:
For those who hope for DOGE to eliminate trillions in waste, or those who fear brutal austerity, the message from markets is that the huge deficits will continue, with the federal debt likely climbing to over $38 trillion by the end of the year. This is one reason markets see a 40% chance that the US credit rating gets downgraded this year.
While the US has only a 22% chance of a recession, China is currently at 48%, Britain at 80%, and Germany at 91%. The Fed probably cuts rates twice to around 4.0%.
Will wage growth keep pace with inflation? It’s a tossup. Corporate tax cuts are also a tossup. The top individual rate probably won’t fall below it’s current 37%.
If you want to make your own predictions for the year, but don’t want to risk money betting on Kalshi, there are several forecasting contests open that offer prizes with no risk:
ACX Forecasting Contest: $10,000 prize pool, 36 questions, must submit predictions by Jan 31st
Bridgewater Forecasting Contest: $25,000 prize pool, half of prizes are reserved for undergraduates. Register now to make predictions between Feb 3rd and March 31st. Doing well could get you a job interview at Bridgewater.
Will a recession happen? It’s famously hard/impossible to predict. Personally, I have a relatively monetarist take. I consider the goals of the Federal reserve, what tools they have, and how they make their decisions. I also think about the very recent trend in the macroeconomy and how it’s situated relative to history. Right now, the yield curve has been inverted for quite some time and the Sahm rule has been satisfied, both are historical indicators of recession.
Recessions are determined by the NBER’s Business Cycle Dating Committee. They always make their determination in hindsight and almost never in real time. They look at a variety of indicators and judge whether each declines, for how long, how deeply, and the breadth of decline across the economy. So plenty of ‘bad’ things can happen without triggering a recession designation.
In my expert opinion, recessions can largely be prevented by maintaining expected and steady growth in NGDP. This won’t solve real sectoral problems, but it will help to prevent contagion and spirals. The Fed can control NGDP to a great degree. In doing so, they can affect unemployment and growth in the short run, and inflation in the medium to long run.
One drawback of the NGDP series is that it’s infrequent, published only quarterly. It’s hard to know whether a dip is momentary, a false signal that will later be updated, or whether there is a recession coming. So, what should one examine? One could examine leading indicators or the various high-frequency indicators of economic activity. But those are a little too much like tarot cards and fortune telling for my taste.
The Fed has now almost landed the plane, bringing us down from 9% inflation during the Covid era to something approaching their 2% target today. But it is not yet clear how hard the landing will be. Back in March I thought recurrent inflation was still the big risk; now I see the risk of inflation and recession as balanced. This is because inflation risks are slightly down, while recession risk is up.
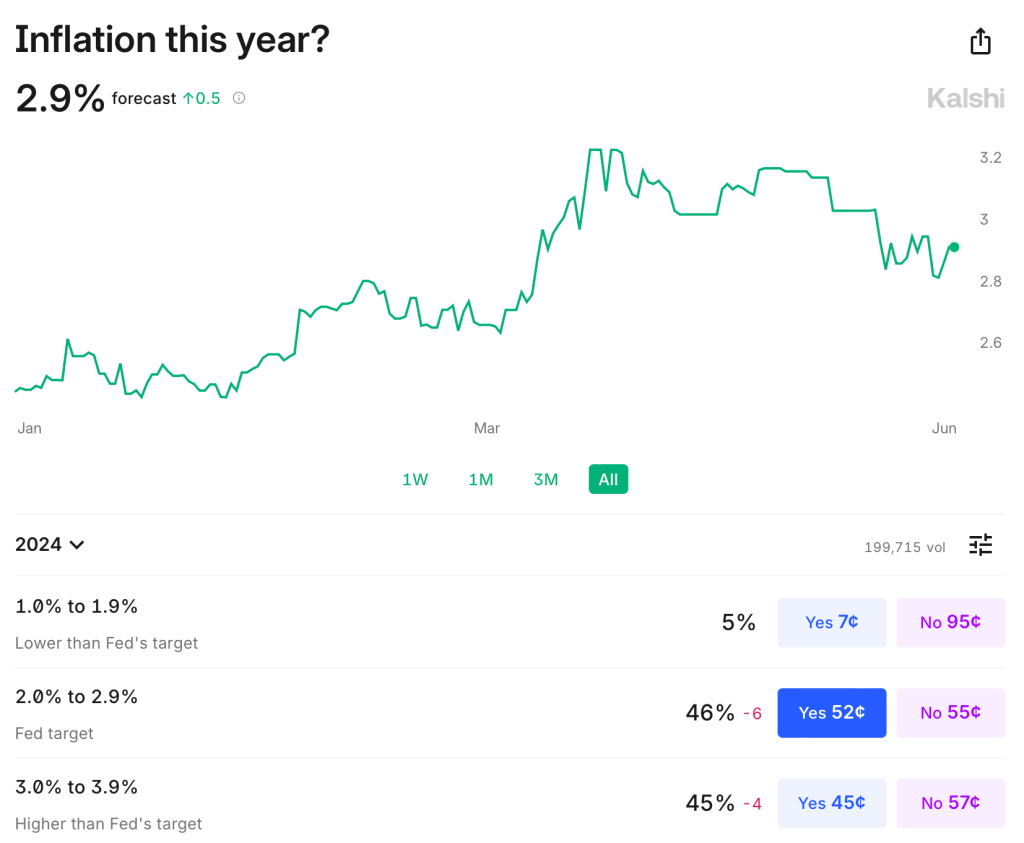
Inflation remains somewhat above target: over the last year it was 3.3% using CPI, 2.7% by PCE, and 2.8% by core PCE. It is predicted to stay slightly above target: Kalshi estimates CPI will finish the year up 2.9%; the TIPS spread implies 2.2% average inflation over the next 5 years; the Fed’s own projections say that PCE will finish the year up 2.6%, not falling to 2.0% until 2026. The labels on Kalshi imply that markets are starting to think the Fed’s real target isn’t 2.0%, but instead 2.0-2.9%:
The Fed’s own projections suggest this to be the somewhat the case- they plan to start cutting over a year before they expect inflation to hit 2.0%, though they still expect a long run rate of 2.0%. In short, I think there is a strong “risk” that inflation stays a bit elevated the next year or two, but the risk that it goes back over 4% is low and falling. M2 is basically flat over the last year, though still above the pre-Covid trend. PPI is also flat. The further we get from the big price hikes of ’21-’22 with no more signs of acceleration, the better.
But I would no longer say the labor market is “quite tight”. Payrolls remain strong but unemployment is up to 4.0%. This is still low in absolute terms, but it’s the highest since January 2022, and the increase is close to triggering the Sahm rule (which would predict a recession). Prime-age EPOP remains strong though. The yield curve remains inverted, which is supposed to predict recessions, but it has been inverted for so long now without one that the rule may no longer hold.
Looking through this data I think the Fed is close to on target, though if I had to pick I’d say the bigger risk is still that things are too hot/inflationary given the state of fiscal policy. But things are getting close enough to balanced that it will be easy for anyone to find data to argue for the side that they prefer based on their temperament or politics.
To me the big wild card is the stock market. The S&P500 is up 25% over the past year, driven by the AI boom, and to some extent it pulls the economy along with it. The Conference Board’s leading economic indicators are negative but improving overall this year; recently their financial indicators are flat while non-financial indicators are worsening.
Overall things remind me a lot of the late ’90s: the real economy running a bit hot with inflation around 3% and unemployment around 4%; the Fed Funds rate around 5%; and a booming stock market driven by new computing technologies. Naturally I wonder if things will end the same way: irrational exuberance in the stock market giving way to a tech-driven stock market crash, which in turn pushes the real economy into a mild recession.
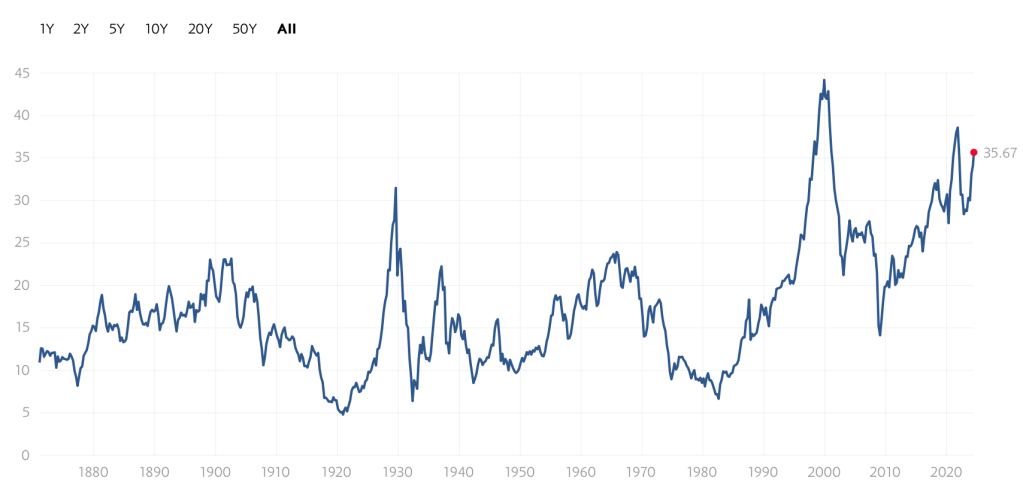
Of course there is no reason this AI boom has to end the same way as the late-90’s internet boom/bubble. There are certainly differences: the Federal government is running a big deficit instead of a surplus; there are barely a tenth as many companies doing IPOs; many unprofitable tech stocks already got shaken out in 2022, while the big AI stocks are soaring on real profits today, not just expectations. Still, to the extent that there are any rules in predicting stock crashes, the signs are worrying. Today’s Shiller CAPE is below only the internet and Covid meme-stock bubble peaks:
Again, this doesn’t mean that stocks have to crash, or especially that they have to do it soon; the CAPE reached current levels in early 1998, but then stocks kept booming for almost two years. I’m not short the market. But the macro risk it poses is real.
Everyone else keeps asking when the Fed will cut rates, and yesterday Chair Powell said they will likely cut this year. Either they are all crazy or I am, because almost every indicator I see indicates we are still above the Fed’s inflation target of 2% and are likely to remain there without some change in policy. Ideally that change would be a tightening of fiscal policy, but since there’s no way Congress substantially cuts the deficit this year, responsibility falls to the Federal Reserve.
Lets start with the direct measures of inflation: CPI is up 3.1% from a year ago. The Fed’s preferred measure, PCE, is up 2.4% from a year ago. Core PCE, which is more predictive of where inflation will be going forward, is up 2.8% over the past year. The TIPS spread indicates 2.4% annualized inflation over the next 5 years. The Fed’s own projections say that PCE and Core PCE won’t be back to 2.0% until 2026.
The labor market remains quite tight: the unemployment rate is 3.7%, payroll growth is strong (353,000 in January), and there are still substantially more job openings than there are unemployed workers. The chattering classes underrate this because they are in some of the few sectors, like software and journalism, where layoffs are actually rising. Real GDP growth is strong (3.2% last quarter), and nominal GDP growth is still well above its long-run trend, which is inflationary.
I do see a few contrary indicators: M2 is still down from a year ago (though only 1.4%, and it is up over the past 6 months). The Fed’s balance sheet continues to shrink, though it is still trillions above the pre-Covid level. Productivity rose 3.2% last quarter.
At least over the past year I think fiscal policy is more responsible than monetary policy for persistent inflation. But I can’t see Congress doing a deficit-reducing grand bargain in an election year; the CBO projects the deficit will continue to run over 5% of GDP. That means our best chance for inflation to hit the target this year is for the Fed to tighten, or at least to not cut rates. If policy continues on its current inflationary path, our main hope is for a deus-ex-machina like a true tech-fueled productivity boom, or deflationary events abroad (recession in China?) lowering prices here.
I keep reading and hearing people who are waiting for the shoe to drop on the next recession. They see high interest rates and… well, that’s what they see. Employment is ok and NGDP is chugging along.
One indicator of economic trouble is the delinquency rate on debt. That’s exactly what we would expect if people lose their job or discover that they are financially overextended. They’d fail to meet their debt obligations. But the broad measure of commercial bank loans is quiet. Not only is it quiet, it’s near historic lows in the data at only 1.25% in 2023Q2. Banks can lend with a confidence like never before.
But maybe that overall delinquency rate is obscuring some compositional items. After all, we know that many recessions begin with real-estate slowdowns. Below are the rates for commercial non-farmland loans, farmland loans, and residential mortgages. All are near historical lows, though there are hints that they’re might be on the rise. But one quarter doesn’t a recession make. I won’t show the graph for the sake of space, but all business loan delinquency rates have also been practically flat for the past five years.
A stopped clock is occasionally right. And so are perma-bears, those commentators or analysts who continually predict that GDP and stocks will plunge – perhaps in the next quarter, but more often say six months from now. (And that deadline keeps getting pushed back every six months).
When I was first getting started investing, I was overly influenced by these seemingly cautious and sober souls, and I consequently lost out considerably compared to my colleagues who blithely stayed fully invested. So I hold my native pessimism in check when investing, and stay mainly in the market, but with a little cash in reserve just in case The Big One hits.
All that said, I do try to sample various points of view. If I have been mainly seeing positive chatter, I turn to my favorite perma-bear, an analyst named Jeffrey Snider. His YouTube channel is called Eurodollar University, and he runs a subscription service as well.
Jeff seems like a genuinely nice guy, who believes that his dire readings of the macroeconomic tea leaves are helping folks avoid disaster. His demeanor is more like an earnest teacher, not a huckster trying to sell something. I should add that he offers meaningful insights on the Eurodollar scene, which is globally significant and which most analysts do not understand or even recognize.
But Jeff’s bias is nearly always toward the negative, and it is something of a good-natured joke among his viewers. Typical comments: “ The market can remain irrational longer than Jeff can stay pessimistic” and “Jeff is the best on Youtube. I watch his videos every night right before I go to bed. In less than 5 minutes, I’m in a semi-conscious coma. Its better than any sleeping pill. That smooth soothing voice extoling the virtues of a collapsing economy works wonders. A++”.
Well, what is the bear-meister saying now? He claims that the seemingly red-hot employment numbers that have been reported in recent months are less hot than they appear. I will paste in a few snips from his recent YouTube, It Just Happened…The JOB MARKET JUST BROKE!! .
One point he makes is that there has been a persistent, inaccurate bias to the upside in the payroll numbers reported by the BLS. These big numbers are what gets reported; what does not get reported so much is, month after month, these monster payroll increases are quietly revised downwards, often by substantial amounts:
Even with the adjustments, these still seem like large increases in employment. Undaunted, Jeff pokes holes in the hot labor market scenario by claiming that full time employment is actually stagnant; it is the rise in part-time workers that creates the seemingly large army of the newly employed. The fact that total hours worked has plateaued seems to support his case here:
Another factor is worker hoarding. Employers were so burned trying to scramble for workers during the 2022 reopening-from-Covid that they are keeping their workers on payroll (even part-time), just in case the economy picks up and they need to pull them in full-time. A case in point is manufacturing. New orders are down considerably this year, and headed even lower, yet manufacturers have not cut their workforces appreciably:
If orders stay low for a long enough time, however, the manufacturers will have no choice but to start massive layoffs.
As another indicator of labor market softness, temporary workers may be a leading indicator of employment trends. They are not such a core part of a company, so there is less hoarding of them. And temporary help services have been in a steady decline this year, which is consistent with a cooler economy:
Sell Everything??
As I said, it is worth considering all sides. I think the specific points mentioned above are all valid ones. I would add that if students actually start payments on all those loans which taxpayers and the Fed have subsidized for the past three years, that will finally put a crimp in the spending. Also, the surprise downgrade of U.S. federal debt by the Fitch rating agency , and resulting jump in interest rates, has finally gotten people talking about out-of-control government spending, for one week anyway. Also, the great China-reopening that was supposed to jump-start the global economy seems to be pretty flat.
However, a couple of counter-points to the bearish narrative:
First, even if manufacturing is rolling over, in the U.S. it is fairly small relative to services. At least in some geographical areas, my anecdotal reports say that it is still a challenge to get good workers to do services.
Second, the tidal wave of cash from pandemic giveaways that washed into our collective bank accounts is still not depleted. Consumer confidence is high, and we are spending freely. This economy is a big, big ship, and it is still steaming full ahead, brushing aside high interest rates and yield curve inversions. The recession seems to continually recede. There will inevitably be a downturn someday, of course, but absent some geopolitical event, I think it may take some time for it to arrive.
And finally, even if the long-awaited recession does arrive, it may not necessarily be so bad for stocks. Since the 2008-2009 Great Financial Crisis, the Fed has taken a very active role in supporting the markets. Wall Street has been conditioned to expect the Fed to flood the system with money if a serious downturn occurs. Also, the Street is betting that there will be enough howls of pain over the high interest being paid on the federal debt that unbearable pressure will be brought on the Fed to loosen up; the vaunted independence of that institution will be put to the test, with Congressional threats to alter their charter if they don’t cave to pressure. And so, “[economic] bad news is [investing] good news”, in contrast to the pre-2008 world. Furthermore, federal deficit spending ramps up during recessions, and as noted in The Kalecki Profit Equation: Why Government Deficit Spending (Typically) MUST Boost Corporate Earnings , this deficit spending tends to boost earnings.
And so even if Jeff Snider is correct that the economy is rolling over and will soon slide downward, this may not give investors a very useful signal. As another one of his YouTube viewers has commented, “This channel is a masterclass in learning that knowledge about the macro environment does not provide an edge in markets.”
About one year ago, I wrote a post with the title “Are We in A Recession?” At the time there was much talk, both in the popular media and among economists, about whether we were in a recession or not, and what “technically” counts as a recession. Now with hindsight, I think we can pretty clearly say that we were not in a recession last summer, nor at any point in 2022.
One thing is true: GDP did decline for two quarters in the first half of 2022. In fact, even the more nuanced “real average of GDP and GDI” declined for two quarters. But as I explained in that July 2022 post, that’s not how the NBER defines a recession. It often coincides with their defined recession, but they used a separate set of indicators. And while some economics textbooks do use the two quarters of declining GDP definition, as I explained in a follow-up post, that’s not the most common textbook definition.
The first half of 2022 is a good candidate for a possible recession, but when we look at the NBER’s preferred 6 measures of economic activity, it seems pretty clear that this was not a recession. If you start the data in the last few months of 2021, you do have small declines in two measures through July 2022 (real personal income and real manufacturing sales), but this looks nothing like past recessions, which have large declines in all or most of the 6 measures.
OK, but that was then, this is now. Are we in a recession now or headed into one? You can find lots of models and surveys or different groups of economists out there. I’m not sure that any particular one is the best, so I won’t dive into those. But if we look at the average of GDP and GDI again, we do notice that 2022q4 was negative and 2023q1 was very weak. Maybe that was a recession?
Again, we can start the NBER indicators around that time to see. Starting from September 2022, we can indeed see that there is some weakness in a lot of the measures for the next 2-3 months. But when we look out 6 months or so from then, we once again only have 2 of the 6 indicators that are below the September 2022 level, and the declines are mild (less than 1 percent). You can play around with the start date a bit, but I think September is the best candidate for a peak, and it’s still pretty weak.
OK, OK, you say, but that’s still all the past. What about the future? Sorry dear reader, I don’t have a crystal ball or the economic equivalent (a model). All I can say is what the data shows right now (which is always backward looking), and as of right now most broad measures of the economy aren’t declining. Yet!
This doesn’t mean everything is great in the economy. Inflation is bad. Poverty is bad. Inequality is, often, bad. We always have these things. But are they getting better? Or are they getting worse? A recession is a particularly bad thing, and something that is often hard to precisely define and measure (for good reason: the economy is complex and hard to measure!). All indication of the available data is that, whatever other bad things are happening right now, a recession is probably not one of those things.
Where is that recession that pundits have been predicting for over a year now? The suspense is killing me. Despite savage hikes in interest rates that have led to a collapse in regional banks and in home buying, the economy just keeps chugging along, and inflation continues to run way above the targeted 2% level. What’s going on?
An article I just read on the Seeking Alpha applied finance website points to three interrelated factors. I will cite and credit the author (whose moniker is “Long-Short Manager”; he runs a couple of investment funds) for the content here, while noting that I agree with his points based on other reading. These points all relate to ongoing strong financial position of the (average) American consumer, who mainly drives the spending in our economy.
( 1 ) Reduced Debt Service
The article notes:
The graph above shows household debt payments as a percent of disposable personal income going back to 2000. Since peaking at 13% right before the financial crisis, it steadily improved to 2020, with a subsequent large drop due primarily to lowered mortgage rates (usually the largest debt obligation of a household). It is the lowest it has been this century.
(Although mortgage rates have jumped in the past year, most existing mortgages were taken out pre-2023, when interest rates had been pushed to near zero by the Fed.)
( 2 ) Robust Wage Growth
The next graph from the Atlanta Fed’s wage tracker (note that the methodology used by this tracker is fundamentally different from the Fed’s employment cost index …) shows that job hoppers on average are making about 3% more than core inflation (call that 5%) whereas the average stayer is making a half percent over core inflation. This is allowing people to catch up for the year that they got behind on inflation.
Likewise, the author notes that although job quits have come down in the past year, they remain well above re-COVID levels.
( 3 ) We Are Still Spending Down Gigantic Pandemic Stimulus Windfall
As we have noted earlier, the government/Fed combination dumped some $4 trillion into our collective pockets in 2020-2021. This includes enhanced unemployment benefits as well as direct stimulus payments, at a time when much of our normal spending (e.g., on travel, sports, commuting, etc.) was curtailed. We are still spending down these excess savings at a good clip, which seems to be a fundamental driver of the currently robust economy:
The last figure on the consumer shows how excess savings (defined as the extra savings consumers accumulated during the pandemic due to fiscal transfers and reduced spending due to lockdowns) has evolved – it should now be around 700 billion and ought to be fully depleted by the end of the year – leaving the consumer still with the lowest debt service ratios of the century and wages caught up with inflation. If you are wondering why we haven’t had a recession despite economists saying we will have it within 6 months for about 12 months now, these charts should tell you why. The tailwind from consumers has exceeded any headwinds from reduced investment due to higher rates.