I’ve discussed the ways to teach supply and demand in the past. Regardless, almost all principles of economics classes require a book. But even digital books are often just intangible versions of the hard copy. Supply and demand are illustrated as static pictures, using arrows and labels to do the leg-work of introducing exogenous changes. There’s often a text block with further explanation, but it lacks the kind of multi-sensory explanation that one gets while in a class.
In a class, the instructor can gesticulate and vary their speech explain the model, all while drawing a graph. That’s fundamentally different from reading a book. Studying a book requires the student to repeatedly glance between the words and the graph and to identify the appropriate part of the graph that is relevant to the explanation. For new or confused students, connected the words to one of many parts of a graph is the point of failure.
This is part of why the Marginal Revolution University videos do well. They’re well produced, with context and audio-overlaid video of graphs. It’s pretty close to the in-person experience sans the ability to ask questions, but includes the additional ability to rewind, repeat, adjust the speed, display captions, and share.
Have you ever tried to do something objectively. It’s impossible. We might try, but how do we know when we’ve failed to compensate for a bias or when we’ve over compensated. Russ Roberts taught me 1) all people have biases, 2) all analysis is by people, & 3) analysis should be interpreted conditional on the bias – not discarded because of it.
The only people who don’t have biases are persons without values – which is no one. We all have apriori beliefs that color the way that we understand the world. Recognizing that is the first step. The second step is to evaluate your own possible biases or the bias of someone’s work. They may have blind spots or points of overemphasis. And that’s OK. One of the best ways to detect and correct these is to expose your ideas and work to a variety of people. It’s great to talk to new people and to have friends who are different from you. They help you see what you can’t.
Finally, because biases are something that everyone has, they are not a good cause to dismiss a claim or evidence. Unless you’re engaged in political combat, your role is usually not to defeat an opponent. Rather, we like to believe true things about the world. Let’s get truer beliefs by peering through the veil of bias to see what’s on the other side. For example, everyone who’s ever read Robert Higgs can tell that he’s biased. He wants the government to do much less and he’s proud of it. That doesn’t mesh well with many readers. But it’d be intellectually lazy to dismiss Higgs’ claims on these grounds. Higgs’ math and statistics work no differently than his ideological opponents. It’s important for us to filter which claims are a reflection of an author’s values, and the claims that are a reflection of the author’s work. If we focus on the latter, then you’ll learn more true things.
Know Multiple Models
In economics, we love our models. A model is just a fancy word which means ‘argument’. That’s what a mathematical model is. It’s just an argument that asserts which variables matter and how. Models help us to make sense of the world. However, different models are applicable in different contexts. The reason that we have multiple models rather than just one big one is because they act as short-cuts when we encounter different circumstances. Understanding the world with these models requires recognizing context clues so that you apply the correct model.
Models often conflict with one another or imply different things for their variables. This helps us to 1) understand the world more clearly, and 2) helps us to discriminate between which model is applicable to the circumstances. David Andolfatto likes to be clear about his models and wants other people to do the same. It helps different people cut past the baggage that they bring to the table and communicate more effectively.
For example, power dynamics are a real thing and matter a lot in personal relationships. I definitely have some power over my children, my spouse, and my students. They are different kinds of power with different means and bounds, but it’s pretty clear that I have some power and that we’re not equal in deed. Another model is the competitive market model that is governed by property rights and consensual transactions. If I try to exert some power in this latter circumstance, then I may end up not trading with anyone and forgoing gains from trade. It’s not that the two models are at odds. It’s that they are theories for different circumstances. It’s our job to discriminate between the circumstances and between the models. Doing so helps us to understand both the world one another better.
I’ve taught GT a total of 5 time. Below are my average student course evaluations for “I would recommend this class to others” and “I would consider this instructor excellent”. Although the general trend has been improvement, improving ratings and the course along the way, some more context would be helpful. In 2019, my expectations for math were too high. Shame on me. It was also my first time teaching GT, so I had a shaky start. In 2020, I smoothed out a lot of the wrinkles, but I hadn’t yet made it a great class.
In 2021, I had a stellar crop of students. There was not a single student who failed to learn. The class dynamic was perfect and I administered the course even more smoothly. They were comfortable with one another, and we applied the ideas openly. In 2022, things went south. There were too many students enrolled in the section, too many students who weren’t prepared for the course, and too many students who skated by without learning the content. Finally, in 2023, the year of my changes, I had a small class with a nice symmetrical set of student abilities.
Historically, I would often advertise this class, but after the disappointing 2022 performance, and given that I knew that I would be making changes, I didn’t advertise for the 2023 section. That part worked out perfectly. Clearly, there is a lot of random stuff that happens that I can’t control. But, my job is to get students to learn, help the capable students to excel, and to not make students *too* miserable in the process – no matter who is sitting in front of me.
Joy: This post was written by my friend and fellow econ professor Cameron Hardwick.
One of my biggest ongoing teaching challenges is keeping students engaged during lectures.
Sure, there are ways to add interactivity here and there, but sometimes there’s just no way around an old-fashioned lecture.
There are a few ways of dealing with this, and I haven’t been satisfied with any.
It’s their grade, if they zone out that’s on them. In terms of the incentives, sure, the externalities are all internalized. But as a macroeconomist, I also know: if time-inconsistency problems are hard for policymakers, how much more for students! We shouldn’t be surprised when students do poorly if the main feedback they get from paying attention or not comes a week later with the homework grade.
Posing questions and waiting for answers. Either you get a minute of awkward silence, or you get the same two engaged students answering everything while everyone else keeps zoning out.
Cold calling. I started doing this a few years into teaching. The advantage is that it keeps students on their toes and paying attention. But a few problems left me unsatisfied:
“How about you in the red shirt”. Hard to catch a student’s attention that way, and in a class of 40 or more, learning names takes a good chunk of the semester.
I had no systematic way of keeping track of participation. Every semester I’d look at the roster and still have a few names I couldn’t put a face to.
Humans are really bad at making random choices! Much as I tried, I couldn’t guarantee I wasn’t biased toward or against (say) the corners of the room, or students whose names I knew.
LMS software. These can offer a lot of great student participation tools. But students have to pay for them – which isn’t worth it if you’re just looking for one feature. On top of that, then you’re locked into an ecosystem.
So, I made an app myself. It does one thing and does it well.
Pick.al (pronounced Pickle) picks students at random from a roster and keeps track of participation points. I can now pose a question in class, ask “what do you think…”, pull out my phone and hit a button, and have a name.
I can also record the quality of their answers:
✓: 1 point, good attempt! (Since this is for participation points, I record ✓ whether right or wrong, as long as they give it a good shot)
?: 0.5 points, if they ask “wait, what was the question?”
×: 0 points, if they’re not there or don’t respond at all.
There’s also a 1-5 scale option, for those who want a more fine-grained evaluation.
This has a lot of benefits in the classroom:
Since I can call on students by name, I learn names more quickly.
Pick.al chooses randomly from the pool of students who have been called on the least so far. So, I know my participation points are as fair as possible.
Students know they can get called on at any time, so they pay attention more in class, and then do better on the homeworks and tests.
Students appreciate being brought in more frequently. One noted on the evaluations the first semester I piloted it: “something specific I like is he got the class involved by calling people out which forced them to test their knowledge which is something teachers need to do more of.”
Using Pick.al is as simple as registering (with an email address or an OrcID), uploading a roster, and then hitting a button during class. You can also swipe through the history and edit or undo participation events, and go back in the admin interface and add, edit, and remove participation events after the fact if necessary.
Pick.al is secure and password-protected, and has a number of handy features:
You can set excused absences if a student lets you know beforehand, so their name doesn’t come up until a certain date.
You can select specific students from the roster in a sidebar, if you want to give credit to – say – a student who raises his hand unbidden.
If you’d like to use the classroom computer instead of pulling out a phone, you can use it with full keyboard navigation.
Scores can be downloaded as a CSV to be put in your own gradebook.
Private notes can be added to students to show up when their names are selected, e.g. “sits in the back corner”
If you use it and find a bug or have an idea that would make it more useful to you, feel free to let me know. It’s been a great tool in my own classes, and I hope it’ll be useful for other teachers to keep students engaged too.
It’s been almost a decade since I taught principles of economics classes. One major allocation of my time this semester is course prep, since I am teaching 3 different classes.
For my Principles of Microeconomics course, I chose Modern Principles of Economics, because I figured Tyler and Alex had done a good job and I have heard good reviews from others.
I’m writing a short review of their instructor resources, and then I’ll have to get back to course prep.
Like most textbooks, they provide you with slides that you can modify. Not having to start from scratch on lecture slides is great.
They also have teacher guides for each chapter. I find these helpful, because I have not taught this class in many years. Even though “I’m an economist,” there is still a technique to presenting these ideas for the first time to undergraduates. No need to re-invent that wheel completely.
They have suggestions for in-class activities. For example, to illustrate demand shifts, ask the students about a recent celebrity scandal and how that created a fall in the demand for concert tickets. It works. Everyone loves talking about celebrity scandals. It will be an evergreen idea. There are always new scandals for each semester – the students know more about it than the professors. My students (Fall 2023) informed me that Lizzo got in hot water for fat-shaming.
Their online learning platform called Achieve within MacMillan works well. It integrates really well with Canvas, our LMS. One warning I would give you is to make sure that students buy Achieve through an account on their .edu email address. I have headaches over students signing up with a personal email address and then not having their data integrate with Canvas.
You can sign up for EconInbox, which will email you topical relevant news stories right before you would want to present them in class. You’ll have to tell them ahead of time what your schedule of topics is, but that is something you ought to have worked out in your syllabus at the beginning of the semester. Obviously, you can’t cover every chapter in one semester. There are far more resources, generally, than you can use. But picking and choosing from a great library is easier than trying to build something from scratch yourself.
Lastly, the Cowen Tabarrok textbook integrates nicely with the free Marginal Revolution University video library. MRU is free to all. So, as an instructor you could still use it heavily even if you are not assigning their textbook or even if you are not doing Achieve. Still, I think that making use of the MRU resource is easiest if you are using their textbook. A fun video that might even be worth using class time for is Avengers: The Story of Globalization
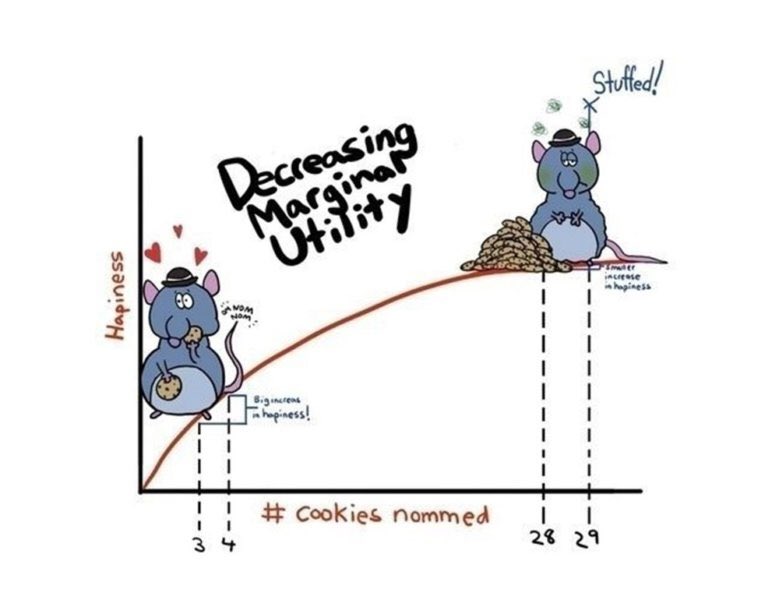
This week on Twitter (X.com), someone said it was their favorite graph. Upon replying I learned that he had used it for teaching. It’s fun when you know one of your ideas is out in the world helping people.
For real? I absolutely HOWLED when I found it on a google image search! Bravo! I taught HS Econ for many years and this was the kind of stuff that kept kids awake!
Blogger privilege is to manifest a new conversation on here. If one of my research articles were to achieve the same level of influence as the stuffed rat, then people might tweet something along the following lines:
This original project, both in terms of methodology and subject, is one of the first controlled experiments on intellectual property protection, which has inspired subsequent lab work on this issue. We present a color cube mechanism that provides a creative task for subjects to do in an experiment on creative output. The results indicate that IP protection alone does not cause people to become inventors, although entrepreneurs are encouraged to specialize by IP protection.
“Smile, Dictator, You’re On Camera,” (2017), with Matthew McMahon, Matthew Simpson and Bart Wilson. Southern Economic Journal, 84:1, 52-65.
The dictator game (DG) is attractive because of its simplicity. Out of thousands of replications of the DG, ours is probably the controlled experiment that has reduced “social distance” to the farthest extreme possible, while maintaining the key element of anonymity between the dictator and their receiver counterpart. In our experiment the dictator knows they are being watched, which is the opposite of the famous “double-blind” manipulation that removed even the view of the experimenter. As we predicted, people are more generous when they are being watched. Anyone teaching about DGs in the classroom should show our entertaining video of dictators making decisions in public: https://www.youtube.com/watch?v=vZHN8xyp6Y0&t=22s
There is a lot of talk about reference points. No matter how you feel about “behavioral” economics, I don’t think anyone would deny that reference-dependent behavior explains some choices, even very big ones like when to sell your house. Considering how important reference points are, can people conceive of the fact that different people have different reference points shaped by their different life experiences? Results of this study imply that I tend to assume that everyone else has my own reference point, which biases my beliefs about what others will do. Because this paper is short and simple, it would make a good assignment for students in either an experimental or econometrics class. I have a blog post on how to turn this paper into an assignment for students who are just learning about regression for the first time.
“If Wages Fell During a Recession,” (2022) with Daniel Houser, Journal of Economic Behavior and Organization. Vol. 200, 1141-1159.
The title comes from Truman Bewley’s book Why Wages Don’t Fall during a Recession. First, I’ll take some lines directly from his book summary:
A deep question in economics is why wages and salaries don’t fall during recessions. This is not true of other prices, which adjust relatively quickly to reflect changes in demand and supply. Although economists have posited many theories to account for wage rigidity, none is satisfactory. Eschewing “top-down” theorizing, Truman Bewley explored the puzzle by interviewing—during the recession of the early 1990s—over three hundred business executives and labor leaders as well as professional recruiters and advisors to the unemployed.
By taking this approach, gaining the confidence of his interlocutors and asking them detailed questions in a nonstructured way, he was able to uncover empirically the circumstances that give rise to wage rigidity. He found that the executives were averse to cutting wages of either current employees or new hires, even during the economic downturn when demand for their products fell sharply. They believed that cutting wages would hurt morale, which they felt was critical in gaining the cooperation of their employees and in convincing them to internalize the managers’ objectives for the company.
We are one of the first to take this important question to the laboratory. The nice thing about an experiment is that you can measure shirking precisely and you can get observations on wage cuts, which are rare in the naturally occurring American economy.
We find support for the morale theory, but a new puzzle got introduced along the way. Many of our subjects in the role of the employer cut the wages of their counterpart, which probably lowered their payment. Why didn’t they anticipate the retaliation against wage cuts? That question inspired the paper “My Reference Point, Not Yours.”
Andreoni & Miller (2002) have been cited over 2500 times for their experiment that shows demand curves for altruism slope down. Economic theory is not broken by generosity. We extend their work to show that demand curves for equality slope down. Individuals don’t love inequality, but they also don’t love parting with their own money. There is a higher demand for reducing inequality with other people’s money than with own income.
This is the last paper I’ll do here. At this point, readers probably would like a funny animal picture. Here’s a meme about the difficult life of computer programmers:
For decades, tech skills have had a high return in the labor market. There is very little empirical work on why more people do not try to become computer programmers, although there are policy discussions about confidence and encouragement.
I ran an experiment to measure something that is important and underexplored. One thing I found is that attempts to increase confidence, if not carefully evaluated, might backfire.
Would you predict it’s more important to have taken a class in programming or for a potential worker to report that they enjoy programming? My results imply that we should be doing more to understand both the causes and effects of subjective preferences (enjoyment) for tech work.
A few more decades to go here… I will try to top the stuffed rat picture.
I’ve written previously on game theory, about the generality of Pure Strategy Nash Equilibria (PSNE), and the drawbacks of Sub-Game Perfect Nash Equilibria (SGPE). In this post I have another limitation for SGPE.
First, some definitions: PSNE: “No player can change one of their strategies and improve their payoff, given the strategies of all other players.” Subgame: “A subset of any extensive-form game that includes an initial node (which doesn’t share an information set with other nodes) and all its successor nodes.” Subgame Equilibrium (SGE): “The PSNE of the Subgame” SGPE: “The set of PSNE that are also SGE”
Clearly, there is nothing inconsistent about the above definitions. The reason that SGPE emerged was because some PSNE assert that a player would be willing to choose strategies that do not maximize conditional payoffs in subgames that are off of the equilibrium path. So, people often characterize the SGPE as a player ‘being rational each step of the way in each subgame’.
But, there is a problem. “Each step of the way” and “in each subgame” are not the same thing. Each step of the way implies that a player is rational at each decision – ie, at each information set. But, not every information set is a subgame! So, a SGPE can include rationality at each SGE while also permitting some irrationality at individual information sets. Since economists like to identify the bounds of their claims, let me emphasize the word can. In order to be correct, I need only identify one case in which the claim is true.
Sometimes you read an academic article and the author fills in the data gaps with interpolation. That is, they assume some functional form of the data and then replace the missing values with the estimated ones. Often, lacking an informed opinion about functional form, authors will just linearly interpolate between the closest known values. Sometimes this method is OK. But sometimes we can do better.
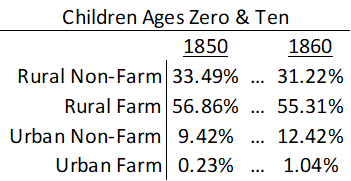
Historical census data provides a good example because the frequency was only every ten years. Say that we want to know more about child migration patterns between 1850 and 1860. What happened in the intervening years? Who knows. Let’s look at the data.
Using data on individuals who have been linked across censuses allows us to fill in the gaps a little bit. For simplicity, let’s just look at whether a child migrant lived in an urban location and whether they lived on a farm. That means that there are 4 possible ways to describe their residence. Below is a summary of where children migrants lived at the age of zero in 1850 and where the same children lived a decade later at the age of ten in 1860 given that they moved counties.
When I’m the mean time did these children move from one place and to the other? We don’t know exactly. The popular answer is to say that they moved uniformly throughout the decade. That’s ‘fine’. But it assumes that the rate at which people departed places was rising and the rate at which they arrived places was falling. Maybe that’s true, but we don’t really know. Below-left is a graph that shows the linear interpolation.
The nice thing about linear interpolation is that everyone is accounted for at each point in time. The total number of people don’t rise or fall in the intervening interpolation period. But if we were to assume that children departed/arrived at each type of place at a constant rate (maybe a more reasonable assumption), then suddenly we lose track of people. That is, the sum of people dips below 100% as people depart faster than they arrive.
Demography is cool generally, but life tables are really cool in their elegance. Don’t know what a life table is? Let me ‘splain.
A life table uses data from private or public death registers, or even genealogical records, to identify a variety of survival and death estimates. Briefly, the tables include for each age:
Probability of death in the next year
Probability of surviving to the age
The life expectancy
There is more in the tables, but these are the big items that people often want to know. All of the various table columns can be calculated from survival rates. The US government and the UN each has created many such tables for a variety of time, locations, and development details. For example, the earliest and most dependable one is from 1901 and includes separate tables by race, sex, migrant status, urbanity, and even for some specific states.
I’m gearing up to teach macroeconomics for the first time. The following is a story that I will keep in mind as I work to make technical material relevant to undergraduates.
Years ago, I was an undergraduate sitting in a macroeconomics class. As it happened, I was in an intermediate-level macro class with no relevant background or context for the material. (If I had taken principles-level econ, then maybe I wouldn’t have been in this situation.)
My instructor was grinding through theory in a methodical way. By the end of the first month, as I remember it, we had covered the short run and the medium-term effects of monetary policy.
For anyone who is not familiar, see these MRU videos on shifting the aggregate supply curve.
In summary, the government can inject money into the economy to achieve a short-term increase in output. For a short amount of time, you can help, and that seemed good to me. I had signed up for the course to understand how to reduce poverty and make the world better. I was acing the exams. Things were going well at first.
Then we got bad news. Increasing the money supply does not work for long. Consumers realize that everything is more expensive, so they cut back on real spending. The economy shifts back to where it was before. Nothing actually improves. I had spent a month of my life on this class and we were getting nowhere.
After the lecture on returning to the long-run aggregate supply curve, I went up to the professor after class. I asked him what was going on and when would we learn something that matters. (I was polite. I realized I was going to sound dumb to him, but life is short. I needed to know if this class was going to deliver anything.)
He looked at me, surely confused that I was unsatisfied with the standard progression of material in his course. Then he explained, “Oh. You are talking about the long term, and we will get to that next month.” That’s what I needed. I did not drop the course or the major. I’m an economics professor today because I didn’t mind looking like an idiot if I could get my questions answered.
This story helps me remember what it was like to be an undergrad in an economics class. Tyler says “context is that which is scarce.” Economics teachers need to do two things at once: present technical material and provide context. I will try to get that mix right going forward.
Note to students: Students, don’t be afraid to ask stupid questions. This is your chance. A good teacher will be glad you took the initiative. However, if the question occurs to you right in the middle of a lecture, then it may or may not be the appropriate time for the lecturer to stop and have a conversation with you. Teachers will be most amenable to having a deep conversation after class or during office hours.