Who’s afraid of ranked choice voting?

Alaska had it’s first election with a new voting rule and Tom Cotton is pissed.

I want very badly to be snarky here and make fun of the Senator for being so nakedly Trumpian in an effort to discredit any democratic institution the instant it doesn’t produce exactly the result he prefers. Fun aside, snark at Senator’s expense misses the bigger and more important mechanisms that are in play. I think the current instantiation of the Republican party is afraid of ranked choice voting. The Senator, in his angry little tweet, only lends greater credence to the theory. More broadly, its often worth unpacking when incumbents get upset about legitimate institutions, particularly when that anger is asymmetric across parties and coalitions.

What is ranked choice voting?

Quickly, ranked choice voting is any system where voters are asked to rank some number of candidates, n, from 1st to nth. Those rankings are then used to implement a runoff system, where a winner isn’t declared until a candidate he or she has a majority of the top choice votes. If someone has 50% of the first place votes, they win and it is effectively no different that a standard plurality system (i.e the standard system in most US elections). If no one has >50% of the first place votes, then the candidate with the fewest first place votes is eliminated and all of their votes are then divvied up amongst the candidates based on those voters’ 2nd choices. The process then iterates, tallying up the votes, eliminating the last place candidates, and allocating votes from the eliminated candidates based on their 2nd, 3rd, etc choice preferences. The election isn’t called until someone has greater than 50% of the counted votes.

It’s not a point system, like a Borda count, so it doesn’t grant a specific weight to being a 2nd or 3rd choice, so the balance of outcomes is still heavily tilted towards a voter’s top choice candidate. It’s not explicitly an approval system, though voters are under no obligation to rank all of the candidates i.e. if you only want to choose a 1st and 2nd choice out of 10 candidates, that is fine. What the system is explicitly designed to do is reduce the impact of large numbers of candidates splitting the electorate so thinly as to increase electoral noise while also reducing the impact of otherwise irrelevant candidates. It’s not a perfect system (nothing is), and it certainly doesn’t magically nullify the irrefutable math of Arrow’s impposibility theorem. It’s just another way of counting votes, and one that is in no way controversial or even especially complicated compared to the variety of voting rules used in established democracies around the world.

So why the fuss?

Political fragility

Overspecialization is an ecological trap, just ask the koala. Sure, it’s great if you can digest and subsist off of a food source that no one else can, that sounds like a swell way to avoice resource competition. But if you overspecialize in that food such that you can no longer live off anything else, well, then you aren’t likely to survive any meaningful shift in you environmental context. What someone like Nicolas Taleb extolls the virtues of anti-fragility, a lot of what he is talking about is akin to adaptability to and tolerance for unforecastable events.

At the moment, if we can put aside policy positions entirely for a moment, there is an argument to be made that the Republican party is looking incredibly fragile. A sequence of events, some slow progressions over the last 20 years, others shocking events of the last 20 months, have left the Republicans looking highly specialized. Senator Cotton’s response to the outcome in Alaska leads me to wonder if they are electorally specialized to succeed in a context that doesn’t exactly exist anymore.

When I think of the Republican coalition and electoral base, what stands out in sharpest relief is:

  1. The urban-rural divide
  2. Single-issue voters, predominantly regarding abortion and firearms
  3. Trump

The urban-rural divide, specifically the overwhelming dominance of Republicans in rural settings, is the fulcrum upon which Republicans leverage their advantage through gerrymandered district maps. By cracking and packing districts, they’ve ceded a large number of landslide urban districts to Democrats for the express purpose of leaving them thinner elsewhere. The catch with gerrymandering as a minority party in the broader population, though, is that if you get greedy you can go grow accustomed to lots of predictable, but nonetheless narrow victories. Narrow victores, no matter how previously safe and easy to forecast, do not grant a lot of leeway for absorbing electoral shifts. Like, for example, significant numbers of educated urban voters moving to medium-sized cities in red and purple states.

Abolishing abortion has long been a rally cry to turn out voters, and seemingly a pretty good one at that. While pro-choice voters may be just as passionate, protecting the status quo has rarely the same draw as tearing down a cruel and unjust system. Voters may have remained the same, but the status quo has changed and, with it, the prospects for drawing voters to the polls.

Bizarre as it would have seemed to say this 10 years ago, Trump is a bonafide cult of personality. His people love him and he has as much influence with at least half the Republican party as anyone since Reagan, and probably more than even he did. I wouldn’t have said this 10 months ago, but there is a very real chance that he is going to prison. Even if he doesn’t, though, the investigation and trials are unlikely to put Republicans in a positive light with moderate and independent voters, and without the office of the presidency, Trump lacks the same power to shape the narrative that he previously enjoyed.

Actually, let’s revisit the Trump as Republican icon for a quick moment.

One of Seventeen

In the aftermath of Trump’s surprising win of the Republican presidential nomination in 2016, there was floated the possibility that Trump was a Condorcet loser. That is to say, in a head to head election he would have lost to every other major candidate. A retrospective analysis challenged this idea, suggesting that Trump had far broader support in the party than just a loyal and dedicated minority, but I’m not sure how much of that is a product of post hoc endogeneity.

What is not argued is that the 2016 Republican primary still had a lot of candidates late in the game. Seventeen candidates qualified for the first debate. By the fifth debate there were still 13 candidates sufficiently viable to claim a spot on stage. Even if we can’t perfectly adjudicate who Trump would or would not have beaten head to head, the outcome of the eventual election was highly sensitive to the voting rule given the sheer number of candidates. If the primary had been subject to anything other than standard plurality rule voting, it is highly possible, if not probable, that a different winner would have emerged.

The thing about a polarizing candidate is that you are that much less likely to be anyone’s second choice. Under a plurality system you rely on the people who love you, attack the ones that hate you, and comfortably ignore the rest. But some voting rules increase the cost of those you ignore.

About that Alaska Primary

Did I mention that Alaska didn’t just change the voting system for the general election? They had an open primary (meaning candidates from any party competed to be one of the final four candidates). Through a simple plurality rule election, everyone voted for their favorite candidate and the top 4 advanced to the general election where the ranked choice rule was employed.

What would have happened if such a rule were applied in the Republican primary of 2016? What would happen if such a rule were applied across the country where

  1. Roe vs Wade has been overturned
  2. Trump may very well be going to prison.
  3. A lot of people are moving from big blue cities to low housing costs and adequate amenties of medium size cities in purple states

A Democrat hadn’t won a statewide election in Alaska since 2008. Less than a week ago they did it in an election against a former Alaskan governor and Republican vice presidential nominee who’s been on Saturday Night Live. In the second round of vote counting, the eventual Democratic winner received 29% of the votes redistributed from the Republican who finished in 3rd place. There are, it seems, a lot of Republicans who preferred a Republican to a Democrat, but nonetheless preferred a Democrat to Sarah Palin.

Cotton is right. Republicans should be freaked out

I don’t expect ranked choice voting to sweep the nation (though I do think it is better than a standard plurality rule). But I think it is one more sign that Republicans have become overspecialized as a party and are not well-suited to adapt to changing political landscapes. Big things, like Roe being overturned, happen. The public can turn on any celebrity, including your party’s talisman. Rural voters might still mathematically individually be weighted more in the broad political calculus (cough Senate cough), but there’s still the problem that fewer voters live there, which means it only takes a small percent of the population moving to break your map. And what happens when the baby boomers don’t dominate electoral math anymore?

No, the Republican’s aren’t doomed to irrelevance. Yes, they will adapt and rebrand…eventually. But the reality is that there is no greater sign that a party is forecasting electoral difficulty for themselves than declarations that the system is rigged against them, regardless of whether they are railing against fictional corruption or actual institutions that really do work against them. In both cases, however, they are signaling the same thing: we’re in trouble. The Republican strategy of recent decades has been to terrify and pander to the base, attack and ignore the rest. And it’s worked. Ranked choice voting is a threat to that strategy because it increases the cost of attacking and ignoring voters outside of your base.

Maybe that alone is a sufficient argument for ranked choice voting – it increases the cost of attacking people outside of your political base. Given the evidence of political polarization and associated social fracturing, anything that shifts the balance of political incentives from outgroup antipathy to big-tent inclusion is proabably a good thing for all of us in the long run.

Dog Cartoon Information Warfare for the 21st Century

Russia’s attack on Ukraine has generated a lot of attention. Many people care deeply about this unfolding crisis. I wondered back in March 2022 where all this energy would end up getting channeled?

What I had in mind was not an army of “cartoon dogs”, and yet here we are. Official coverage of the #NAFO dog memes this week has come from the Economist and Politico.

The North Atlantic Fella Organisation (spellings vary) is a tongue-in-cheek label adopted by a virtual army that champions Ukraine’s cause and harangues its foes on social media. Its members don the avatar of a cartoon shiba inu dog…

When your enemy is as humorless as Putin, there is an advantage to being funny. After circulating in internet backwaters for weeks, official Ukrainian accounts have acknowledged the help offered by the movement.

The effects of #NAFO are 1) to influence the flow of information/opinions and 2) raise money for Ukraine defense.

For example, you can buy a “ticket” to a “beach party” in Crimea: https://www.saintjavelin.com/products/crimea-beach-party-early-bird-ticket-sale-1-entry

Mike posted earlier about donating to the Kyiv department of Economics.

And this is a just an aid organization that is not very funny but helps refugees in Lviv.

An explainer of a different Very Online thing is https://www.slowboring.com/p/dark-brandon-explained. Dark Brandon and #NAFO are similar in the sense that supporters are made to feel like they are part of a brotherhood of winners who share fun jokes.

Balaji Srinivasan recently released a book called The Network State suggesting that online communities of likeminded people are so powerful that they could supplant what we have known as “countries” for a few centuries. From what I can tell, families want to live in a real place that has tangible services and security. The interesting thing about #NAFO is that it’s purpose is to support an old-fashioned country defending its physical borders.

Meanwhile, in the country of Russia, as reported by the WSJ, “The chairman of Russia’s second-largest oil-and-gas giant, Lukoil PJSC, died Thursday after falling from a hospital window in Moscow, according to Russian state media agency TASS.”

Series 65 for Economists

Financial discussions often give the disclaimer “this is not investment advice” for legal reasons. I would always see this and wonder, is anyone ever willing to say “this *is* investment advice”?

The answer is, yes, licensed investment advisers do when speaking to their clients. How do people become licensed investment advisers? They start by taking the Series 65 exam.

I decided to take the Series 65 because I thought it would be a good learning opportunity, that it could be fun to tell people “this is investment advice”, and because it also provides the fast track to becoming an accredited investor. I’d like to have the option to invest in startups or hedge funds, but the SEC doesn’t let people do that unless they are rich (consistently over $300k/yr HH income, or $1mil in assets) or a licensed financial professional. I didn’t want to wait years to pass the income or asset tests, and so decided to pass the literal test instead.

I hoped that as a PhD economist who sometimes reads about finance for fun, I could pass the Series 65 without studying. This turned out not to be true, but it also wasn’t wildly wrong. You need to get at least 72% of questions correct to pass; taking a practice test cold I got 62%. I decided to first take the slightly easier Security Industry Essentials exam as a warmup. For both exams, I passed after spending ~ 2 weeks reading through the ~500 page study guides from the Securities Institute of America in my spare time.

For someone with an economics background, the exams will feature a few true econ questions you’ll know cold, a lot of “common sense” finance questions you probably know, some more specific finance questions you probably don’t know, and some specific questions about laws and regulations for investment advisers you almost certainly don’t know. This means you can speed through some parts of the study guide, but will need to slow way down in others. I found myself learning a roughly equal mix of things I’m happy to know for their own sake, things that would only be helpful to the extent I actually work as an investment adviser, and things that seem completely pointless.

Overall this seems like a decent way to spend a bit of time and money. Economists love to complain about people asking us for financial advice, and we tend to either reply “I don’t know, that’s not what economics is about” or give uninformed answers. But it doesn’t take that much time to educate yourself enough to be able to give people good, informed answers, so I think we should do so, especially when the alternatives people turn to tend to either be uninformed (friends or internet randos) or biased (advisers who get paid for steering them to high-fee investments).

That said, if your goal is actually to make money as an adviser or as an accredited investor, the Series 65 exam is only the first hoop to jump through. You still need to get licensed, which means either starting an investment advisory firm or joining one. I haven’t tried to do this yet despite passing the Series 65 in June, as I’ve been busy with my main job. I’d be interested to hear from anyone who has done this, especially anyone who got a part-time or consulting role just to get licensed to make accredited investments. How hard was it, how long did it take, what did you think of the actual work?

“Superabundance” Review

Are resources becoming scarcer as world population increases and per capita consumption increases? Are basic goods becoming more expensive relative to wages in the face of potential resource shortages? These are some of the main questions that are addressed in the just released book Superabundance by Marian Tupy and Gale Pooley. The authors were kind enough to provide me with an advance copy, which is why I’m already able to review this book on its release date (I’m not really that fast of a reader).

The author take a very optimistic view of the issues surrounding those opening questions. Properly measured (one of the key tasks of their work), resources are becoming more abundant, not more scarce. And properly measured, almost all consumer goods are becoming cheaper relative to wages.

The authors use the approach of “time prices” throughout the book. They are not the first to use this approach. Julian Simon (their inspiration for this project) used it in various places in his work. William Nordhaus famously used it is in paper on the history of the price of lighting. And Michael Cox and Richard Alm have used the time-price approach in many of their writings, from the 1997 Dallas Fed annual report, to a full-length book a few years later, as well as updates to the original 1997 report. And if you follow me on Twitter, I like to use this approach too.

In short, “time prices” tell us how many hours of work it takes to purchase a given good or service at different points in time. How many hours would you have to work to buy a pound of ground beef? A square foot of housing? An hour of college tuition? It’s the superior method when you are looking at the price of a particular good or service over time, compared with a naïve inflation adjustment, which only tells you if the price of that good/service rose faster or slower than goods or services in general, not if it’s become more affordable. Inflation adjustments are really only useful when you are trying to compare income or wages to all prices, to see if and how much incomes have increased over time. Of course, which wage series you choose is important (and you need to have a consistent series over time, or at least the end points), but as the authors point out (which they learned from me!), if you looking at wages after 1973, the wage series you use doesn’t matter much. Median wages, average wages, wages of the “unskilled” — these all give you the same trend since 1973. We don’t have all of these back earlier (especially median wages), but there’s not much reason to believe they’ve diverged that much. And the authors also present their data using multiple wage series in many of the charts and tables.

What do the authors find?

Continue reading →

High Yield Investing, 2: Types of Funds; Loan Funds; Preferred Stocks

Types of Funds: Exchange-Traded, Open End, and Closed End

Some investors like to pick individual stocks, while others would rather own funds that own many stocks.  For bonds, investors usually own funds of bonds rather than taking possession of individual bonds.

A straightforward type of fund is the exchange-traded fund (ETF). This holds a basket of securities such as stocks or bonds, and its price is constantly updated to reflect the price of the underlying securities. You can trade an ETF throughout trading hours, just like a stock. If you simply hold it, there will be no taxable capital gains events. Many ETFs passively track some index (e.g. the S&P 500 index of large company stocks) and have low management fees.

An open end mutual fund also trades close to the value of the baskets of securities it holds, but not as tightly as with an ETF. You can place an order to buy or sell an open end fund throughout the day, but it will only actually trade at the end of the day, when the share price of the fund is updated to the most recent value of the net asset value. A quirk of open end funds is that buying and selling by other customers can generate capital gains for the fund, which get distributed to all shareholders. Thus, even if you are simply holding fund shares without selling any, you may still get credited with, and taxed on, capital gains. Also, if a lot of shareholders sell their shares at the bottom of a big dip in prices, the fund must sell the underlying securities at a low price to redeem those shares. This hurts the overall value of the fund, even for customers who held on to their shares through the panic.

Some open end mutual funds offer skilled active management which may meet your needs better than an index fund. For instance, the actively-managed Vanguard VWEHX fund seems to give a better risk/reward balance than the indexed junk bond funds.

Closed-end funds (CEFs) are more complicated. A closed-end fund has typically has a fixed number of shares outstanding. When you sell your shares, the fund does not sell securities to redeem the shares. Rather, you sell to someone else in the market who is willing to buy them from you. Thus, the fund is protected from having to sell stocks or bonds at low prices. The fund’s share price is determined by what other people are currently willing to pay for it, not by the value of its holdings. Shares typically trade at some discount or premium to the net asset value (NAV). The astute investor can take advantage of temporary fluctuations in share prices, in order to buy the underlying assets at a discount and then sell them at a premium. CEFs are typically actively managed, and employ a wider range of investment strategies than open-end funds or ETFs do. CEFs can raise extra money for buying interest-yielding securities by borrowing money. This leverage enhances returns when market conditions are favorable, but can also enhance losses.

Bank Loan Funds

One type of debt security is a loan. Banks can make loans to businesses, with various conditions (“covenants”) associated with the loans. Banks can then sell these loans out into the general investment market.

Most commercial loans are floating-rate, so the interest received by the loan holder will increase if the general short-term commercial interest rate increases. Thus, the loan holder is largely protected against inflation. Loans typically rank higher than bonds in order of payment in case the company goes bankrupt, and some loans are secured by liens on particular company-owned assets like vehicles or oil wells. For these reasons, in the event of bankruptcy, the recovery on loans is higher (around 70%) than for bonds (average around 40%).

Various funds are available which hold baskets of these bank loans, also called senior loans or leveraged loans. One of the largest loan funds is the PowerShares Senior Loan ETF (BKLN), which currently yields about 4.5%. Most of its loans are rated BB and B, i.e. just below investment grade.   There are also closed end funds which hold bank loans, which yield nearly twice as much as the plain vanilla BKLN ETF, by virtue of employing leverage, selling at a discount to the actual asset value of the fund, and expertly selecting higher yielding loans.  For instance,  the Invesco Senior Income Trust (VVR), which I hold,  currently yields 8% , which is enough to keep up with inflation.      

High-Dividend Common Stocks

Most “stocks” you read about are so-called  common stocks. Most company common stocks are valued for their potential to grow in share price or to steadily keep increasing the size of their dividend. The average dividend yield for the S&P 500 stocks is about 1.6%, which is lower than the current yield of the (risk-free) 2-year Treasury bond.

There are some regular (C-corporation) stocks which are not expected to grow much, but which pay relatively high, stable dividends. These include some telecommunication companies like AT&T (T; 6.5%) and Verizon (VZ; 5.9%), electric utilities like Southern (SO; 3.5%) and Duke (DUK; 3.7%), and petroleum companies like ExxonMobil (XOM; 3.6%). Investors might want to buy and hold some of these individual stocks, since these are among the highest yielding, high quality stocks. Broader funds which focus on large high-quality, high-yielding stocks tend to have lower average yields than the stocks mentioned above. For instance the Vanguard High Dividend Yield Index Fund (VHYAX) currently yields only about 3.2 % .  

Preferred Stocks

Companies, including many banks, issue preferred stocks, which behave more like bonds. They  often yield more than either bonds or common stock. Like bonds, most preferreds have a fixed yield; some convert from fixed to floating rate after a certain number of years. Unlike bonds, most preferreds have no fixed redemption date. Fixed-rate preferreds are vulnerable to a large loss in value if interest rates rise, since the shareholder is stuck essentially forever with the original, low rate. On the other hand, if interest rates drop, a company typically can, after a few years, redeem (“call”) the preferred for its face value (typically $25) and then issue a new, lower-yielding preferred stock.

Preferred shares sit above common stock but below bonds in the capital structure. Companies have the option of suspending payment of the dividends on preferred stock if financial trouble strikes. However, a company is typically not permitted to pay dividends on the common stock if it does not pay all the dividends on the preferred stock.

The largest preferred ETF is iShares US Preferred Stock (PFF). It yields about 5.8%, but holds mainly fixed-rate shares. The PowerShares Variable Rate Preferred ETF (VRP; 5.9%  yield) holds variable or floating rate shares, which helps insulate investors from the effects of interest rate raises. The First Trust Intermediate Duration Preferred & Income Fund (FPF) is a closed end fund with more than half its holdings as floating rate. Due to use of leverage and selling at a discount, the fund yield is a juicy 7.9%.

My favorite class of high yield investments is business development companies, discussed here.

Happy investing…

Papers I’ve been reading

In no particular order:

Moonshot: Public R&D and Growth by Shawn Kantor and Alexander Whalley. Whether its going to the moon or vaccinating a country, government spending sure seems to have a much better impact when there is a big, bright, and highly-specific outcome target.

The Economic Consequences of Being Denied an Abortion by Sarah Miller, Laura Wherry, and Diana Greene Foster. Being denied an abortion leads to significant financial distress.

Preferences for Firearms and Their Implications for Regulation by Sarah Moshary, Bradley Shapiro, and Sara Drango. Different types of guns serve as strong substitutes for each other, which will likely temper any regulatory effects from limiting one or more specific strata of firearms. As with any regulation, narrowly identifying what it is you want and expect from the policy remains the key to making an evidence-based argument for it.

A panel-based proxy for gun prevalence in US and Mexico by Daniel Cerquiera, Danilo Coelho, John Donohue, Marcelo Fernandes, and Jony Pinto Junior. Using “percent of suicides committed with a firearm” remains a the best proxy for firearms. Regional variation across the US remains exactly what you’d expect in the US. Is the same true of Mexico?

BONUS PAPER. From twitter this morning:

How Much Should We Trust the Dictator’s GDP Growth Estimates? by Luis Martinez

I’d seen this before, but I think about all the time. We don’t give nearly enough time consideration ro the endogeneity of results to the incentives behind data creation/recording anywhere, let alone autocratic countries. I get why – it invites the dismissal of any data inconvenient to your status quo thinking, but ignoring it completely is foolish.

Economics in Wedding Season

You watch a romantic comedy to feel good. I was tired at the end of last week, so “Wedding Season” Netflix looked like it might be funny. I was not expecting that the protagonist would be an economist.

First, how was the movie? The first half was somewhat entertaining. The second half is too sappy and long for me.

This movie is one of the few movies I know that is just unironically set in New Jersey. There were no jokes about Jersey or Shore folk. New Jersey is where immigrant families from India are making dreams come true. The dialogue about immigrant Indian culture, including arranged marriages, was interesting.

You know the trope about a character becoming rich because they inherited money from an estranged uncle? In Wedding Season, the guy becomes unexpectedly rich from Facebook stock.

Second, how was economics portrayed?

Here is the plot summarized by Wikipedia

Asha is an economist working in microfinance who has recently broken off her engagement and left a Wall Street banking career behind to work for a microfinance startup in New Jersey. Asha’s mother Suneeta, concerned for her future and against the advice of her husband Vijay, sets up a dating profile through which Asha meets Ravi.

In the beginning of the movie, Asha pitches microfinance to investors from Singapore. Asha tries to convince them using graphs and statistics. The investors turn her project down.

Microfinance was hyped in the 2000’s. I believed, so I became a Campus Kiva Representative as an undergraduate. I convinced teens in my dorm to pool our dollars to sponsor a loan for a woman in a poor country. Since then, economists have done empirical work to show that microfinance is not as effective as we hoped (see work by 2019 Nobel Prize Winners Esther Duflo and Abhijit Banerjee). The filmmakers either do not know the latest research or they don’t care. The pitch is still as emotionally appealing as it was when I heard it for the first time 15 years ago, so it makes for good movie scenes.

The irony in Wedding Season is not only that Asha succeeds in getting bankers from Singapore to invest in microfinance but also how she goes about it.

Continue reading →

The Future of Student Debt

Yesterday the Biden administration announced that is forgiving up to $20k per person in student debt. So far we’ve seen lots of debate over whether this was a good/fair idea; as an economist who paid back his own debt early, you can probably guess what I have to say about that, so I’ll move on to the more interesting question of what happens now.

…after sharing one tweet
OK one more, but I promise its relevant

The above is a quote from Thomas Sowell as a political commentator, but he was also a great economist. His book Applied Economics says that the essence of the economic approach to policy analysis is to not just consider the immediate effect, but instead to keep asking “and then what?” So let’s try that here.

We’ll start with the immediate effects. Those whose debt just fell will be happy, and will have more money to spend or save in other ways. The federal government is on the other side of this, they’ll receive less in debt payments and so will have to fund themselves in other ways like borrowing money or raising taxes. People are still trying to estimate how big this transfer from the government to student debtors is, but let’s take the Penn Wharton Budget Model estimate of $330 billion (the actual cost is likely higher, since that estimate is for $10k of loan forgiveness, but the actual program forgives up to $20k for those who had Pell grants). Dividing by US population tells you the cost is roughly $1000 per American; dividing by $10,000 tells you that roughly 33 million debtors benefit.

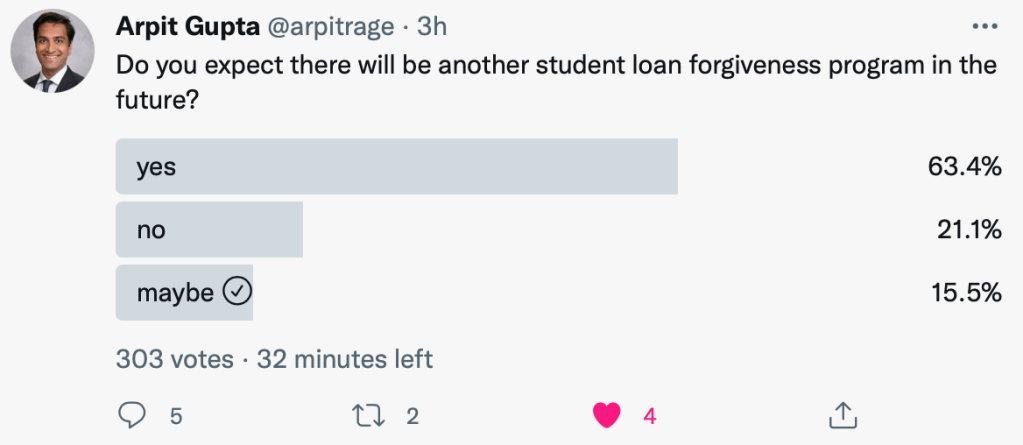
OK, what happens next? The big question is: is this a one-time thing, or does it make future loan forgiveness more or less likely? Later I’ll make the argument for why the answer could be “less”. But right now most people seem to think the answer is “more”, and that belief is what will be driving decisions.

If current and future students think loan forgiveness is likely, they have an incentive to take out more loans than they otherwise would, and to pay them off more slowly (particularly since income-based repayment was just cut from 10% to 5% of income). This higher willingness to pay from students gives colleges an incentive to raise tuition; historically about 60% of subsidized loans to students end up captured by colleges in the form of higher prices:

We find a pass-through effect on tuition of changes in subsidized loan maximums of about 60 cents on the dollar, and smaller but positive effects for unsubsidized federal loans. The subsidized loan effect is most pronounced for more expensive degrees, those offered by private institutions, and for two-year or vocational programs.

Source: https://www.newyorkfed.org/research/staff_reports/sr733.html

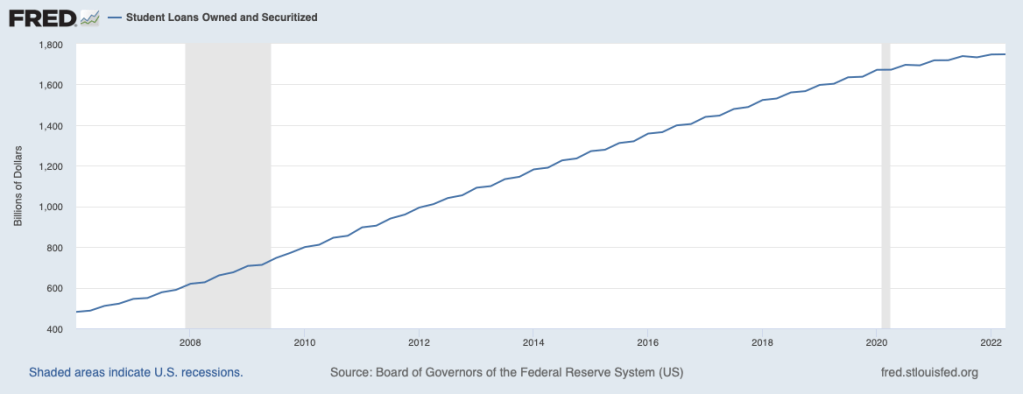
To the extent that you think student debt is a national problem, this action didn’t solve the problem so much as push it back 6 years; wiping out roughly 20% of all student debt brings us back to 2016 levels. So we could end up right back here in 2028, possibly faster to the extent that students borrow more as a result.

Source: https://fred.stlouisfed.org/series/SLOAS#

That, together with the “normalization” of student loan forgiveness, is why people think a similar action in the future is likely. But I’ll give two reasons it might not happen.

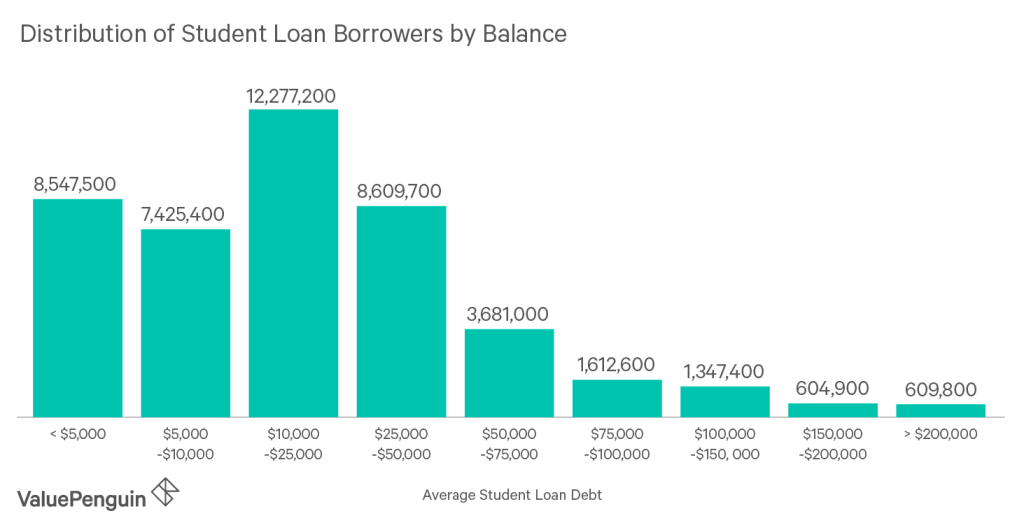
First, this action may have only reduced student debt by about 20%, but it reduced the number of student debtors much more (at least 36%), because most debtors owed relatively small amounts. It will take more than 6 years for the number of voters who’d benefit from loan forgiveness to get back to what it was in 2022, reducing support for forgiveness in the mean time.

Source: https://www.valuepenguin.com/average-student-loan-debt

That also gives Congress plenty of time to do something, even by their lethargic standards. Part of what bothers many people about this loan forgiveness is that it not only doesn’t solve the underlying issue of the Department of Education signing kids up for decades of debt, it will likely worsen the underlying issue through the moral hazard effect I describe above. Forgiveness would be much more popular if it were paired with reforms to solve the underlying issue. While we aren’t getting real reform now, I do think forgiveness makes it more likely that we’ll see reform in the next few years. What could that look like?

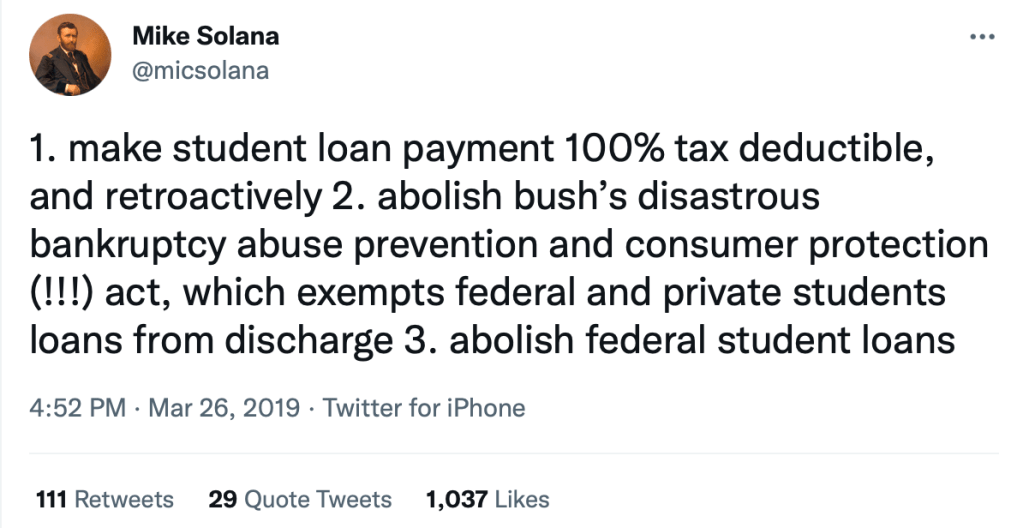
Let’s start with the libertarian solution, which of course won’t happen:

More realistic will be limits on where Federal loan money can be spent, and shared responsibility for colleges. Colleges and the government have spent decades pushing 18 year olds to sign up for huge amounts of debt. While I’d certainly like to see 18-year-olds act more responsibly and “just say no” to the pushers, the institutions bear most of the blame here. The Department of Education should raise its standards and stop offering loans to programs with high default rates or bad student outcomes. This should include not just fly-by-night colleges, but sketchy masters degree programs at prestigious schools.

Colleges should also share responsibility when they consistently saddle students with debt but don’t actually improve students’ prospects enough to be able to pay it back. Economists have put a lot of thought into how to do this in a manner that doesn’t penalize colleges simply for trying to teach less-prepared students.

I’d bet that some reform along these lines happens in the 2020’s, just like the bank bailouts of 2008 led to the Dodd-Frank reform of 2010 to try to prevent future bailouts. The big question is, will this be a pragmatic bipartisan reform to curb the worst offenders, or a Republican effort to substantially reduce the amount of money flowing to a higher ed sector they increasingly dislike?

Are Teacher Salaries Held Back by “Bloat” in K-12 Schools?

In the past 20 years in the US, per pupil spending in K-12 schools has increased by about 20%. That’s in CPI-U inflation-adjusted dollars. What’s the cause of this increase? Higher teacher salaries? Administrative bloat? Something else?

Here’s a chart you may have seen floating around the internet. It shows the growth in the number of employees at K-12 public schools.

This looks like a lot of administrative bloat! The source of the data is the National Center for Education Statistic’s Digest of Education Statistics, Table 213.10.

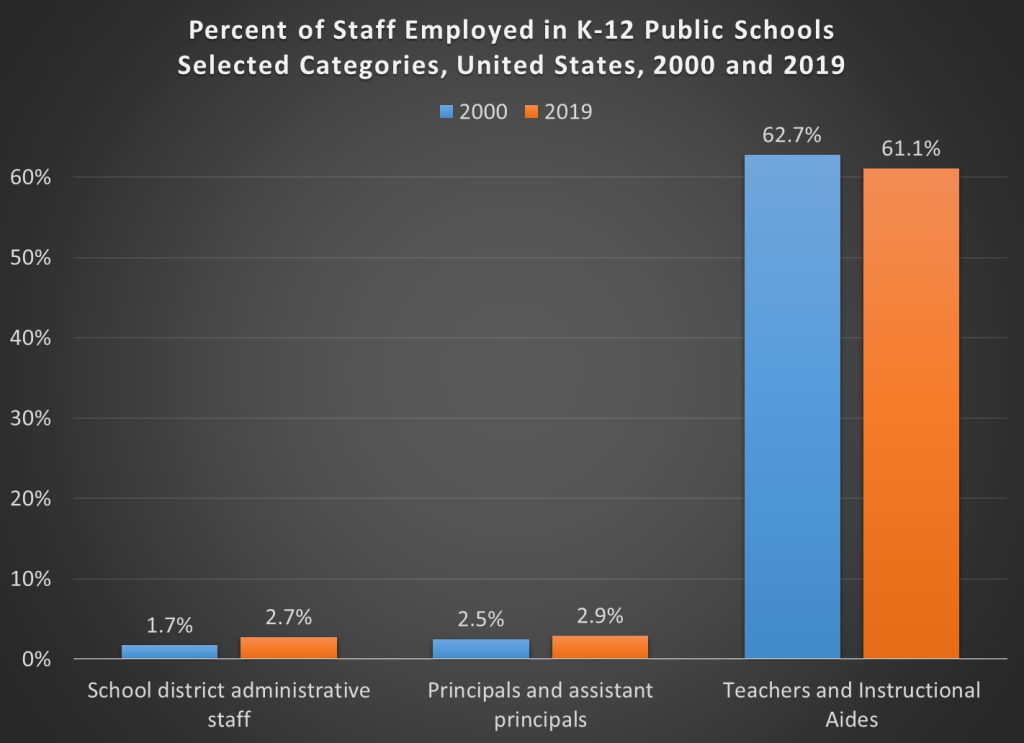
But hold on, here’s another chart, showing the percent of employees in each of these same categories.

The numbers don’t add up to 100% because I’ve left off a few categories (the biggest one is “support staff,” which was 30-31% of the total throughout the time period). But overall, this chart appears to show much less bloat. Instructional staff (including aides) were by far the biggest category of employees in both categories in both time periods. Administrative staff at the district level did grow, but only by 1 percentage point of the total.

What’s the source of this data? Well, it’s a little trick I played. The source is the National Center for Education Statistic’s Digest of Education Statistics, Table 213.10. It’s the exact same data.

How is this possible?

Continue reading →

High Yield Investments, 1: Some Benefits of High Yield Stocks and Funds

A Case for High-Yield Investments

The data I have seen indicates that if you don’t need to draw down your investment for twenty years or more, you may do well to put it all in stock funds and just leave it alone. For reasons discussed here  the average investor will likely do better to buy an index fund like the S&P 500 rather than trying to pick individual stocks. The long term average return (including reinvested dividends) in the U.S. stock market has been about 10 %  before adjusting for the effects of inflation. (All my remarks here pertain to U.S. investments; hopefully some aspects may be applicable to other countries).

However, particularly as you age, financial advisors typically counsel investors to allocate some portion of their portfolio to more-stable fixed-income securities that generate cash to spend and keep you from having to sell stocks during a market downturn. Historically, long-term investment grade bonds have been used to provide steady cash, and to serve as an asset which often went up if stock went down. Thus, a 60/40 stock/bond portfolio was considered prudent. That model has been less useful in recent years, since bond yields have been so low, and since long-term bonds sometimes fall along with stocks, e.g. if long-term interest rates rise.

Another driver now for allocating some savings into non-stock investments is that after the large run-up in stocks last few years, which has far exceeded gains in actual earnings, the market may well muddle along flatter in the coming decade. In regular stock investing, you are banking primarily on stock price appreciation – you are counting on someone else paying you (much) more for your shares some years hence than you paid for them. But what if the “greater fools” don’t materialize to buy your shares?

Also, the inflation genie has been let out of the bottle, and it may be tough to get inflation back under say 4%; investment grade bonds are yielding appreciably less than inflation these days, so you are losing money to buy regular bonds.

Finally, if your stock is cranking out say 8% cash dividends, and you are holding it for those dividends rather than for price appreciation, when the market crashes (and this particular stock goes down in price, along with everything), you can be blithe and unruffled. In fact, you can be mildly pleased if the price goes down since, if you are reinvesting the dividends, you can now buy more shares at the lower price. Trust me, this psychological benefit is important.

Some High Yielding Alternative Investments

In this blog over the coming weeks/months we will identify several classes of securities which generate stock-like returns (around 7-10 % returns, if the dividends are continually reinvested) via dividend distributions rather than through share price appreciation. These securities often have short-term volatility similar to stocks, so they should be treated in the portfolio as partly as stock-substitutes rather than as substitutes for stable high-quality bonds. However, the better classes of high yield investments maintain their share prices over a long (e.g. 5-year) period, similar to bonds, but with much higher yields.

We will discuss High-yield (“junk”) bonds , senior bank loans, preferred stocks, Real Estate Investment Trusts (REITs), Business Development Companies, Master Limited Partnerships,   and selling options (put/calls) on stocks.  

I’ll close today with three examples of these high yield securities, which I have happily held for many years. They yield 8-9%, and their share prices have held relatively steady over the past five years:

Cohen&Steers Total Return Realty Fund (RFI). Current yield: 8.0 %

Ares Capital   (ARCC)   Current yield:  8.1%

Eaton Vance Tax-Managed Buy-Write Opportunities Fund (ETV). Current yield: 8.8%                    

(Charts from Seeking Alpha)