Everyone feels like we throw away too much stuff. One small way to help is to try to find someone who can use the items before you toss them.
I’m happy to say that one of my economic ideas got to the policy implementation stage. I was staring at the Scout gear my son had grown out of and dreading the thought of throwing it away. I could donate it to Good Will, but I thought that the chances it would get to someone who wants it are very low. What parent wants exactly that stuff? So, I emailed our Pack leader and asked if we could start doing a gear swap.
Parents can bring any scout-related items that they do not want anymore to a pack meeting. It is organized on one table with clear information. Anyone can take anything for free if they can use it and store it.
This works better than posting to internet Buy Nothing groups because the scout parents are right there. No one has to drive across town for a “porch pick up.”
More sports teams or clubs should do this. Seize the moments when like-minded people are already together in one place.
Say that there is a labor market and that there is no income tax. If an income tax is introduced, then what should we expect to happen? Specifically, what will happen to employment, the size of the labor force, and the number of people unemployed? Will each rise? Fall? Remain unchanged? Change ambiguously? Take a moment and jot down a note to test yourself.
As it turns out, what your answer is depends on what your model of the labor market is. Graphically, they are all quantities of labor. The size of the labor force is the quantity of labor supplied contingent on some wage that workers receive. It’s the number of people who are willing to work. Employment is the quantity of laborers demanded by firms contingent on to wage that they pay. Finally, the quantity of people unemployed is the difference between the size of the labor force and the quantity of workers employed (Assuming that the labor force is greater than or equal to employment).
Supporters of prediction markets tend to emphasize how they are great tools for aggregating information to produce accurate forecasts. If you want to know e.g. who is likely to win the next election, you can watch every poll and listen to pundits for hours, or you can take ten seconds to check the odds. This is great for people who want information- but how do prediction markets fare as investments for their actual participants?
Zero Sum
The big problem with prediction markets as investments is that they are zero sum (or negative sum once fees are factored in). You can’t make money except by taking it from the person on the other side of the bet. This is different from stocks and bonds, where you can win just by buying and holding a diversified portfolio. Buy a bunch of random stocks, and on average you will earn about 7% per year. Buy into a bunch of random prediction markets, and on average you will earn 0% at best (less if there are fees or slippage).
Low Liquidity
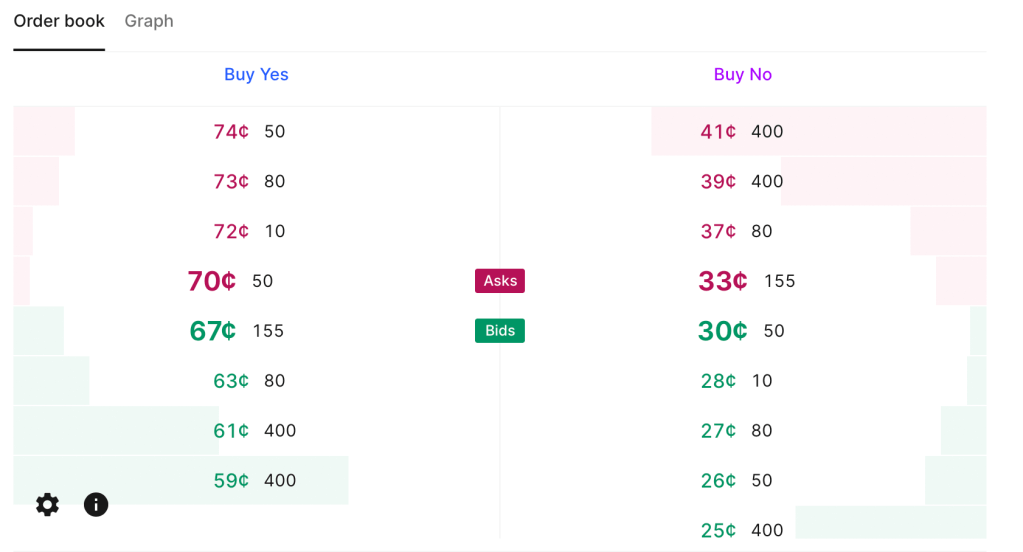
Current Kalshi order book for “Will June 2024 be the hottest June ever“. Betting $200 on either outcome could move the price by 5 cents (so move the estimated probability by 5pp).
This zero sum problem is close to inevitable based on how prediction markets work. They currently have one other big problem, though it is not inevitable, and is getting better as they grow: liquidity. There are some stocks and bonds where big institutions can buy or sell millions of dollars worth without moving the price. But in markets like Kalshi or PredictIt, I personally move prices often by betting just hundreds, or sometimes even just tens, of dollars. Buying at scale means getting worse prices, if you can even buy at all. PredictIt has a bet limit of $850 per contract for regulatory reasons. This definitely excludes institutional investors, but even for individuals it can mean many markets aren’t worthwhile. Say an outcome is already priced at 90 cents, the most you can make by betting it happens is about $94. That’s not nothing but its also not enough to incentivize lots of in-depth research, especially given the risk of losing the $850 if you are wrong and the opportunity cost of investing the money in stocks or bonds. Kalshi in theory allows bets up to $25k, but most of their markets haven’t had the liquidity to absorb a bet anywhere near that (though this could be changing).
Easy Alpha
Given these negatives, why would anyone want to participate in prediction markets, except to gamble or to generously donate their time to create information for everyone else? Probably because they think they can beat the market. Compared to the stock market, this is a fairly realistic goal. Perhaps because the low liquidity keeps out institutional investors, it isn’t that hard for a smart and informed investor to find mispricings or even pure arbitrages in prediction markets. This seems to be especially true with political prediction markets, where people often make bets because they personally like or dislike a candidate, rather than based on their actual chances of winning; that is exactly the kind of counterparty I want to be trading with.
I’ve been on PredictIt since 2018 and earned a 16% total return after fees; this was on hundreds of separate trades so I think it is mostly skill, not luck. Of course, even with this alpha, 16% total (not annual) return over 6 years is not great compared to stocks. On the other hand, I tended to put money in right before big elections and take it out after, so the money is mostly not tied up in PredictIt the whole time; the actual IRR is significantly better, though harder to calculate. On the other other hand, the actual dollar amount I made is probably not great compared to the time I put in. On yet another hand, the time isn’t a big deal if you are already following the subject (e.g the election) anyway.
Uncorrelated Alpha
The other big positive about prediction markets is that there is no reason to expect your returns there are correlated with your returns in traditional markets. Institutional investors are often looking for investments that can do well when stocks are down, and are willing to sacrifice some expected returns to get it. In fact, there may be ways to get a negative correlation between your prediction market returns and your other returns, hedging by betting on outcomes that would otherwise harm you. For instance, you can hedge against inflation by betting it will rise, or hedge against a recession by betting one happens. If you are right, you make some money by winning the bet; if you are wrong, you lose money on the bet but your other investments are probably doing well in the low-inflation no-recession environment.
Going Forward
Prediction markets have long been in a regulatory grey area in the US, but with the emergence of Kalshi and the current CFTC, everything may soon be black and white. Kalshi has won full approval from the CFTC for a variety of markets, but the CFTC is moving to completely ban betting on elections (you can comment on their proposal here until July 9th).
One great place to discuss the future of prediction markets will be Manifest, a conference hosted by play-money market Manifold in Berkeley, CA June 7-9th. It features the founders of most major US predictions markets and many of the bestwriters on prediction markets. I’ll be there, and as I write tickets are still available.
Many people have nostalgia for nominal prices of the past. I’ve written about this topic in various contexts before, but the primary error in doing this is that you must also look at nominal wages from the past. Prices in isolation give us little context of how affordable they were.
One area with a lot of nostalgia is food prices of the past, specifically grocery prices (I’ve also written about fast food prices). While I have addressed grocery price inflation since 2021 in another post (it’s bad, but probably not as bad as social media leads you to believe), there is another version of grocery price nostalgia that goes back even further. For example, this image shows up on social media frequently with nostalgia for 1980 prices:
(Note that the image also mentions housing prices, but the clear focus of the image is on groceries. I won’t dig into housing in this post, but it’s something I have written a lot about before, and I would recommend you start with this post on housing prices from February 2024. But she sure looks happy! As models often do in promotional photos.)
Could you buy all those groceries for $20 in 1980? And how should we think about comparing that to grocery prices today?
One approach to grocery affordability is to look at how much a family spends as a share of their budget on food and other items. In the past I’ve used this approach to show that food spending has fallen dramatically over time as a share of a household’s budget, including since the early 1980s. But perhaps that approach is flawed. Maybe housing has got more expensive, so families are cutting back on food spending to accommodate for that fact, but they are getting less or lower quality food.
For another approach, I will use Average Price Data for grocery items from the BLS CPI series. Note that I am using actual average retail price data, not prices series data, which means there are not adjustments for quality changes or substitutions. No funny stuff, just the raw price data (the only adjustment is if product sizes changes, which of course we want them to do, so we aren’t fooled by shrinkflation — so BLS uses a constant package size, such as 1 pound for many items or a dozen eggs, etc.).
The items I have chosen out of the 150-plus price series are the 24 items which are available in both 1980 and 2024. There may be some biases by doing this, but in general BLS is continuing to collect data on things that people continue buying. So it’s the best apples-to-apples comparison we can do (note that there are no apples in this list! Apples are tracked in the CPI, but there is no continuous price series from 1980 to 2024 for one apple variety).
How best to compare prices over time? Rather than “adjusting for inflation,” as is common in the popular press and by some economists, a better approach that I and other economists use is called “time prices.” Time prices show the number of hours or minutes it would take to purchase the good in two different years, using some measure of wages or income (I will use both average and median wages in this post). By looking at prices compared with wages for individual items, we can see whether each items as well as the entire basket has become more or less affordable.
Here is what time prices for these 24 items look like if we use average wages (I use a series that covers about 80% of the workforce, but excludes supervisors and managers). For this chart, I use prices in April 1980 and April 2024, since there is some seasonality to some prices (and April 2024 is the most recent price and wage data available, so it’s as current as I can get).
The chart shows that for 23 out of the 24 items, it takes fewer minutes of work to buy the items in April 2024 than it did in April 1980. For many items, it is a huge decrease: 13 items decrease by 30 percent or more (30 percent is also the average decrease). And while we once again might be concerned by selection bias of the goods, we have a nice variety here of proteins, grains, baking items, vegetables, fruits, snacks, and drinks. Unfortunately for the bacon lovers out there it is the one product going in the other direction, but there are still a variety of other proteins that have become much more affordable (pork chops are much cheaper!).
Here’s one way in which the image of the lady shopping wasn’t wrong: you could get a basket of groceries for about $20 in 1980. The basket I’ve put together (which is obviously different from the woman’s basket, but you work with the data you have) would cost $27 if you bought the package sizes BLS tracks (e.g., one pound for most of the meats and produce). In 2024, that same basket would cost $84. That’s 3 times as much! But since wages are over 4 times higher, the family is better off and groceries are, in a real sense, more affordable.
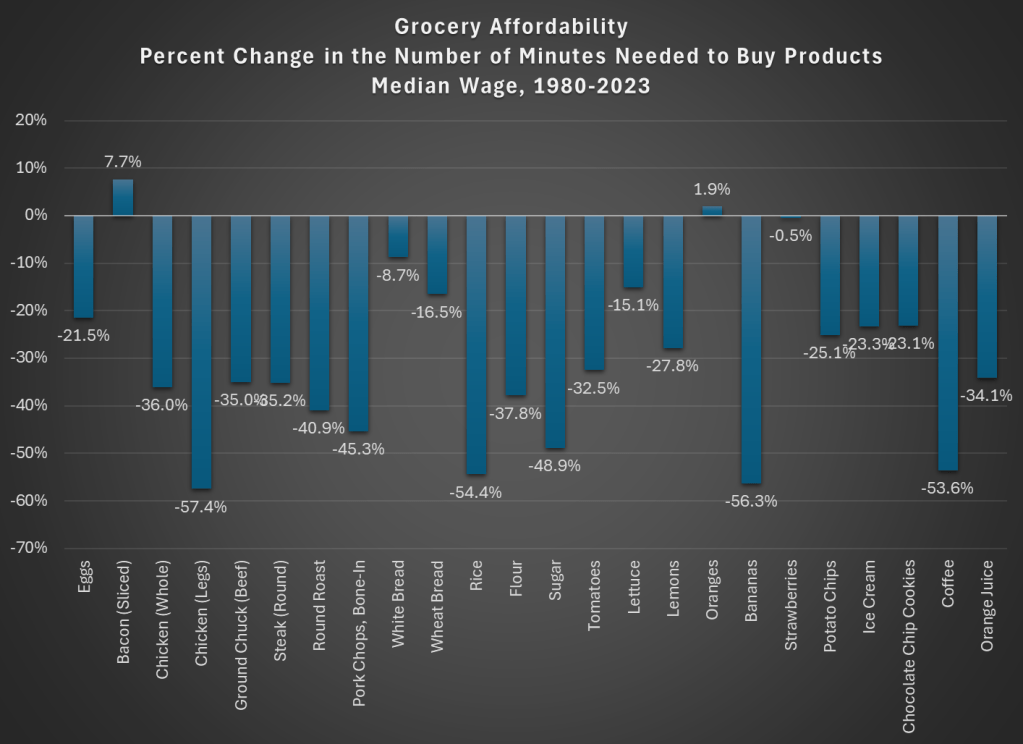
Speaking of wages though, is my chart perhaps biased because I’m using the average wage? What if we used another measure, such as the median wage? For that, I can use the EPI’s median wage series (which comes from the CPS), and I also converted it to a nominal wage for 2023. This wage data is only available annually, with the most recent being 2023, so I will also use 2023 price data for this chart (note: for oranges and strawberries, I use the second quarter average price, since they weren’t available year round in 1980 — another subtle example of growing abundance and prosperity today).
The immediate thing you will notice is that there isn’t much difference between the average wage chart. Bacon is still less affordable. We know have oranges being slightly less affordable and strawberries being basically the same, though keep in mind as I mentioned above the chart that these weren’t available year-round in 1980.
But other than bacon and those seasonal fruits, everything is more affordable in 2023 than 1980. The average decrease is the same as the prior chart: 30 percent fewer minutes of work at the median wage to purchase this basket of goods, with 13 of the 24 items decreasing by more than that 30 percent average. The reason for this similarity is that both the average and median wages as measured by these series are more than 4 times higher than 1980.
But are these 24 items representative of other grocery items that we don’t have complete price data in the public BLS series? They are probably pretty close. The unweighted percent change in the items from April 1980 to April 2024 was 201%. If we use the CPI Food at Home component, which includes many more items but also changes in composition as buying habits change, we see a slightly larger 255% increase. But that is still less than wages have increased since 1980 (by over 300% for both average and median wages). As our incomes rise, we will naturally switch to better and more expensive foods, which can explain the 255% vs 201% difference in price increases, but it also shows the BLS isn’t engaging in any funny business with the indexes: if they kept the basket of goods constant, price increases would be smaller.
While the rise in prices since 2021 might rightly make us nostalgic for the pre-pandemic era of prices, let’s not be nostalgic for 1980 grocery prices.
I ran across an article by Lyn Schwartzer on seeking Alpha last week, which I thought was insightful regarding investments. Here is my summary.
The article is Most Investments Are Bad. Here’s Why, And What To Do About It. The article’s first bullet point is “Historical data shows that the majority of investments, including bonds, stocks, and real estate, perform poorly.” Unpacking this, looking at various investment classes:
Bonds and Stocks
Investment-grade bonds typically pay interest rates just a little above inflation, so it’s not surprising that they have been mediocre investments over the long-term. The prices of long bonds (10 years or more maturity) tended to rise between about 1985 and 2020, as interest rates came steadily down, but that tailwind is pretty much over.
It has been known for years, e.g. from a study by Hendrik Bessembinder, that only a tiny fraction of stocks makes up the vast majority of returns in equity markets. I wrote about this a couple of years ago on this blog.:
The rise of the S&P is entirely due to huge gains by a tiny subset of stocks. The average stock actually loses money over both short and long time periods. … half of the U.S. stock market wealth creation [1926-2015] had come from a mere 0.33% of the listed companies… Out of some 26,000 listed companies, 86 of them (0.33%) provided 50% of the aggregate wealth creation, and the top 983 companies (4%) accounted for the full 100%. That means the other 25,000 companies netted out to zero return. Some gave positive returns, while most were net losers.
As investors, we of course want to know how to lock in on those few stocks that will perform well. I see two approaches here, not mentioned in the article. One is to be very good at analyzing the finances and market environments of companies, to be able to pick individual firms which will be able to grow their profits. Being lucky here probably helps, as well. An easier and very effective method is to simply invest in the S&P 500 index funds like SPY or VOO. Because these funds are weighted by stock capitalization, they inexorably increase their weighting of the more successful companies and dial down the unsuccessful companies. This dumb, automatic selection process is so effective that it is very difficult for any active stock-picking fund manager to beat the S&P 500 for any length of time.
What the article suggests in this regard is to focus on businesses that have “durable competitive advantages (network effects, powerful brands, intangible property, economies of scale, oligopoly participation, and so forth),” or to try to pick up decent/mediocre companies at a low price.
The big tech companies which are mainly listed on the NASDAQ exchange have these durable advantages, and indeed the QQQ fund which is comprised of the hundred largest stocks on the NASDAQ has far outpaced the broader-based S&P 500 fund over the last 10 or 20 years.
Real Estate
All of us suburbanites know that owning your own home has been one of the best investments you can make, over the past few decades. The article points out, however, that real estate in general has not been such a great performer. If your property is not located close to a thriving metropolitan area, where people want to live, it can be a dog. The article cites abandoned properties all around Detroit (“large once-expensive homes that are now rotting on parcels of land that nobody wants”), and notes, “In Japan, there are millions of abandoned countryside homes that are nearly free. Many of them are in beautiful and safe rural areas, and yet there is insufficient demand for them.”
And so, “Most real estate falls somewhere between those extremes. It performs decently, especially when considering that it can replace the owner’s rental income or be rented out for cashflows, but after maintenance and taxes are considered, its unlevered total return from price appreciation and cashflow generation net of maintenance leaves something to be desired relative to gold.”
Gold As a Reference
The article uses gold as, well, the gold standard of investing returns. The supply of gold creeps up roughly 1.5% per year, so after say 95 years there is four times as much physical gold as before. We find that an ounce of gold will buy more food or more manufactured goods than it did a century ago, but that is because our efficiency of producing such things has increased faster than the gold supply. On the other hand, “All government bonds have underperformed gold over the long run, and most unlevered real estate has underperformed gold as well.” Stocks in the broad U.S. market (most foreign stock markets did more poorly) greatly outperformed gold, but that is only accomplished by the top 4% of stocks. The other 96% of stocks as group did not generate any excess returns.
Owner-Operators versus Passive Investors
I am looking at these issues from the point of view of a passive investor – I have some extra cash that I want to plow into some investment, and have it return my original capital plus another say 10%/year, without me having to do extra work. It turns out that many companies, especially smaller ones, provide useful products to customers and they make enough profit to pay off the owner/operators and the employees, but not enough to reward outside passive investors, too. These companies serve an important role in society, but are not viable investment vehicles:
Being an owner-operator of a business, or a worker at a business, makes a lot of sense. However, the vast majority of businesses are not strong enough to provide good returns for outside passive investors after all expenses (including salaries) are considered.
Good returns for outside passive investors are reserved for only the best types of companies; companies that are so dominant and high-margin that even after paying all of their executives and workers, they have plenty of excess profits for outside passive investors. Although stocks from any sector can have these characteristics, Bessembinder’s research found that major outperformers were disproportionally concentrated in the technology, telecommunications, energy, and healthcare/pharmaceutical sectors. They are on the right side of an emerging tech trend, they have network effects, they have economies of scale, they have protected intangible property such as patents, or they are part of an oligopoly, and so forth.
Similarly, real estate (especially unlevered), works most easily when it is occupied or used by the owner. After all, you must live somewhere. Now, you can make money buying and renting/flipping properties, but that typically demands work on your part. You add value by fixing the tenant’s toilet or arranging for a plumber, or by scoping the market and identifying a promising property to buy, and by working to upgrade its kitchen. All this effort is not the same as just throwing money at some building as a passive investor, and walking away for five years.
Upping Returns via Leverage
This is a packed sentence: “Historically, a key way to turn mediocre investments into good investments has been to apply leverage. That’s not a recommendation; that’s a historical analysis, and it comes with survivorship bias.”
For example, banks have historically borrowed money (e.g. from their depositors) at lowish, short-term rates, and combined a lot of those funds with the bank corporate equity, to purchase and hold longer-term bonds that pay slightly higher rates. Banks are often levered (assets vs. equity) 10:1. This technique allows them to earn much higher returns on their equity than if they used their equity alone to buy bonds.
It is easy to leverage real estate. If you put 20% down and borrow the rest, bam, you are levered 5:1. Now if the value of your house goes up 6%/year while you are only paying 3% on your mortgage, the return on the actual cash (the 20% down) you put in becomes quite juicy: “After maintenance and recurring taxes, the majority of unlevered real estate, even when rented out for cashflows, doesn’t outperform gold. But unlike gold, 5-to-1 leverage makes real estate actually pretty good in many contexts, and historically allows it to outperform gold.”
Large corporations can leverage up by issuing relatively low-interest bonds: “They can borrow large amounts of money for decades at low interest rates, and use that capital to organically expand their business, buy smaller companies, or buy back their own shares. Either way, they are borrowing abundant fiat currency at low rates and using that capital to build or buy business equity, and they are arbitraging that spread for shareholders.”
Savvy firms like Warren Buffett’s Berkshire Hathaway take it a step further, by having controlling interests in insurance companies, and investing the low-cost “float” funds, as we described here. From the article:
Berkshire has also made a habit out of buying small and medium sized private businesses in full. Many of these smaller companies would have higher borrowing costs if they were independent. But Berkshire can buy a lot of them, and then issue corporate debt at the parent company level at much lower interest rates than any of them could issue on their own. So he can buy a lot of unlevered cashflow-producing small or medium-sized businesses, and turn them into a portfolio of businesses that are levered with Berkshire’s very low cost of capital.
Now other companies like Ares Management and Apollo are jumping onto this arbitrage bandwagon, buying up insurance companies to get access to their captive cash, to be used for investing.
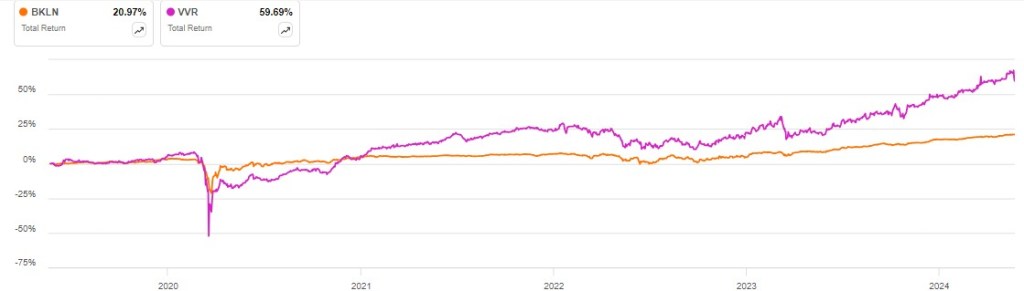
Here is another rough example of the power of leverage. The unleveraged fund BKLN holds bank loans, and so does the closed end fund VVR. But VVR borrows money to add to the shareholders’ equity. There is more complication (discount to net asset value) with VVR which we will not go into, but the following 5-year chart of total returns (share price plus reinvested dividends) shows nearly triple the return for VVR, albeit with higher volatility:
The Changing Global Economic Landscape
The article closes with some summary observations and recommendations. The past 30-40 years have been marked by ever-decreasing interest rates, and by cooperation among nations and generally increasing globalization. It seems that these trends have broken and so what worked for the last four decades (buy stocks, shun gold) may not be as good going forward:
For equity and real estate investors, the key takeaways from this piece are 1) do not extrapolate the prior decades for a given investment and instead assess it with this context in mind, 2) try to emphasize the sectors [such as Big Tech] that Bessembinder identified as ones that disproportionally generate excess returns, and 3) look for companies that have locked in or are otherwise still able to play this arbitrage game going forward in a more difficult environment for it.
Additionally, hard monies [i.e. gold, silver] become a serious alternative once again in this context, and are worth serious consideration for a portfolio slice, because the hurdle rate for stocks to outperform them is high when there are not a lot of tailwinds at the backs of stocks.
Jingi Qui, Tan Chen, Alain Cohn, and Alvin Roth ran a cool field experiment asking the question: does it matter if a prominent economist quote tweets your job market paper? Well, it turns out, yes, it does:
I’m not going to call anyone out, but there was definitely some significant pearl clutching about young careers, IRB, and did the job candidates in the control group give permission to not be retweeted by a prominent economist. I do not care about any of that. I’ll go on the record and say that a) I believe those concerns to be silly and b) if you don’t think they are silly, for your own mental health don’t start digging into how medical science is advanced at the stage of human trials.
What I do care about is the results and what they mean. All publicity is good publicity, doubly so when it implies a famous person has vouched for your paper. It’s the vouching that intrigues me because it’s so weak. It’s a retweeting. It should help you get out of a pile and into a slightly smaller pile. In a job market with a 500-1000 applicants for most positions and only 10-20 first interview slots that lead to 4-7 flyouts, the effect should be trivial. Twenty-five percent additional flyouts is not trivial. If anything it’s catastropic.
“Catastropic” is hyperbole, but this is a blog and that is the currency we deal in.
Twenty-five percent more flyouts are, to me, further evidence of the true source of most of the pathologies of academic economics: we’re overcommitted. We don’t have time to do things like reading papers. This is especially problematic for hiring committees tasked with sorted through 500 to 1000 applicants, each of whom has written a job paper. Careful, dear reader, because you might not like how far this logic can take you.
Why do journal reviews feel so capricious and random? Because the referees don’t have time to read anything or they won’t have time to work on their own submissions. Why does the NBER essentially operate as a club whose principal membership mechanism whether you are a student of a current member at a top 10 school? Because what else are they going to do, read 2000 applicant CVs every year? Why does a three-three teaching load feel utterly damning to those trying to start a research career? Because they marginal cost of additional teaching for someone without any research assistance leaves them a simple choice: no sleep or no research. Do I even have to get into the costs of having children early in careers?
So yeah, if I’m on a hiring committee and someone famous retweets your job market paper, I might just skim it there and then on my computer screen (it’s low marginal cost). It’s there in front of me, so I’ll probably more than read the abstract, I’ll skim the tables and figures too. And that’s all it takes. I’ve got a mandate to come up with a list of 10 candidates I think we should consider interviewing. Who am I to disagree with Famous Economist X when a moment’s humility will put me 10% closer to meeting my obligation?
I’m not saying we’re not star-f…..I’m not saying we’re not status seekers, it’s just that the obsession with status in academia is inframarginal in this context. What’s driving these results is stressed-out folks whose own imposter syndrome makes them incredibly vulnerable to any sort of low-cost information i.e. advertising that offers a new and easy way to economize on their time.
That’s it, that’s the post. I don’t have time to come up with a clever ending.
Today I will write about something I care deeply about: the wellbeing of the moms of young children.
I can remember having a child enrolled in preschool. It was expensive but it was worth it, for us. What follows will be most relevant to readers who are working full-time and have children enrolled in full-time daycare/preschool. That is not the right choice for every family. If it’s the choice you made, then read on.
Do less for preschool. Save your energy and money for the years when your child will actually remember.
Every year my family travels from SW Florida to the mid Atlantic area. Without stops it takes 16-17 hours. With small children, it’s definitely a two day trip. We find that they handle it better if we leave super early, take a longer leg on the first day, then stop at a hotel midway and get the kids in the pool to help burn off some energy. We also rent a suite whenever possible.
We’ve made this trip many times. I use the Bonvoy app which is for Marriott hotels. We even have a particular hotel that we prefer: The Fairfield Inn in Santee, SC. It’s clean, spacious, the employees are welcoming and kind, the breakfast includes cooked items that aren’t bad, it’s within walking distance of a grocery store, and the price isn’t bad at all. Fairfield Inns are generally a great price per quality…. But not in Georgia.
I’ve stopped at several Fairfield Inns in GA: near Atlanta, near Savannah, and we’ve been disappointed. Every. Single. Time. All the margins on which the Fairfield in Santee is great are the same margins on which Georgia ones are poor. I’m sure that there is not just one reason. Maybe there is a bad regional manager or bad assistant to the regional manager. That’s not my primary hypothesis though.
Henrik Karlsson read lots of biographies of geniuses and tried to sum up the things their childhoods had in common here. Some highlights:
At least two-thirds of my sample was home-educated (most commonly until about age 12), tutored by parents or governesses and tutors. The rest of my sample had been educated in schools (most commonly Jesuit schools).
As children, they were integrated with exceptional adults—and were taken seriously by them.
They had time to roam about and relied heavily on self-directed learning
A common theme in the biographies is that the area of study which would eventually give them fame came to them almost like a wild hallucination induced by overdosing on boredom. They would be overcome by an obsession arising from within.
They were heavily tutored 1-on-1
An important factor to acknowledge is that these children did not only receive an exceptional education; they were also exceptionally gifted.
There is lots of discussion of John Stuart Mill and John Von Neumann, who each had major contributions to economics:
When they were done, James Mill took his son’s notes and polished them into the book Elements of Political Economy. It was published the year John Stuart turned fifteen….
There is a moving scene in John Stuart Mill’s biography, when John Stuart is about to set out into the world and his father for the first time lets him know that his education had been . . . a bit particular. He would discover that others his age did not know as much as he did. But, his father said, he mustn’t feel proud about that. He’d just been lucky.
Let’s make more people lucky.
Other nice posts along similar lines are Erik Hoel’s “How Geniuses Used to Be Raised” (linked in Karlsson’s piece), and Scott Alexander’s review of Laszlo Polgar’s book “Raise a Genius” (about raising his 3 daughters to be chess grandmasters). Karlsson’s post, worth reading in full, is here.
Has the US tax and transfer system reached an egalitarian ideal? That’s one reading of this new working paper “How Progressive is the U.S. Tax System?” by Coleman and Weisbach. After accounting for all taxes and transfers (red lines in the charts), Americans across the income distribution saw roughly 250% real gains in income since 1966:
While market income has grown faster at the top of the income distribution (especially the top 1%), we also tax the rich heavily and use much of that tax revenue to fund direct transfers to poorer Americans and fund programs (such as Medicaid) which benefit poorer Americans. Put it all together, and everyone has seen similar gains over the past five decades, and these gains are fairly large: no Great Stagnation!