I recently did some business where I had a text file of names and email addresses that I wanted to send a group email to, in Gmail. Here I will share the steps I followed to import this info into a Google contact group.
The Big Picture
First, a couple of overall concepts. In Gmail (and Google), your contacts exist in a big list of all your contacts. To create a group of contacts for a mass email, you have to apply a label to those particular contacts. A given contact can have more than one label (i.e., can be member of more than one group).
To enter one new contact at a time into Gmail, you go to Contacts and Create Contact, and type in or copy/paste in data like name and email address for each person or organization. But to enter a list of many contacts all at once, you must have these contacts in the form of either a CSV or vCard file, which Google can import. So here, first I will describe the steps to create a CSV file, and then the steps to import that into Gmail.
Comma-separated values (CSV) is a text file format that uses commas to separate values. Each record (for us, this means each contact) is on a separate line of plain text. Each record consists of the same number of fields, and these are separated by commas in the CSV file.
A list of names and of email contacts (two fields) might look like this in CSV format:
Allen Aardvark, aaaardvark@yahoo.com
Bob Branson, sface33@gmail.com
Cathy Chase, cchase27@verizon.net
We could have added additional data (more fields) for each contact, such as home phone numbers and cell numbers, again separated by commas.
For Gmail to import this as a contact list, this is not quite enough. Google demands a header line, to identify the meaning of these chunks of data (i.e., to tell Google that these are in fact contact names, followed by email addresses). This requires specific wording in the header. For a contact name and for one (out of a possible two) email address, the header entries would be “Name” and “E-mail 1 – Value”. If we had wanted to add, say, home phones and cell phones, we could have added four more fields to the header line, namely: ,Phone 1 - Type,Phone 1 - Value,Phone 2 - Type,Phone 2 – Value . For a complete list of possible header items, see the Appendix.
The Steps
Here are steps to create a CSV file of contacts, and then import that file to Gmail:
( 1 ) Start with a text file of the names and addresses, separated by commas. Add a header line at the top: Name, E-mail 1 – Value . If this is in Word, Save As a plain text file (.txt). For our little list, this text file would look like this:
Name, E-mail 1 – Value
Allen Aardvark, aaaardvark@yahoo.com
Bob Branson, sface33@gmail.com
Cathy Chase, cchase27@verizon.net
( 2 ) Open this file in Excel: Start Excel, click Open, use Browse if necessary, select “All Files” (not just “Excel Files”) and find and select your text file. The Text Import Wizard will appear. Make sure the “Delimited” option is checked. Click Next.
In the next window, select “Comma” (not the default “Tab”) in the Delimiters section, then click “Next.” In the final window, you’ll need to specify the column data format. I suggest leaving it at “General,” and click “Finish.” If all has gone well, you should see an Excel sheet with your data in two columns.
( 3 ) Save the Excel sheet data as a CSV file: Under the File tab, choose Save As, and specify a folder into which the new file will be saved. A final window will appear where you specify the new file name (I’ll use “Close Friends List”), and the new file type. For “Save as type” there are several CSV options; on my PC I used “CSV (MS-DOS)”.
( 4 ) Go to Gmail or Google, and click on the nine-dots icon at the upper right, and select Contacts. At the upper left of the Contacts page, click Create Contact. You’ll have choice between Create a Contact (for single contact), or Create multiple contacts. Click on the latter.
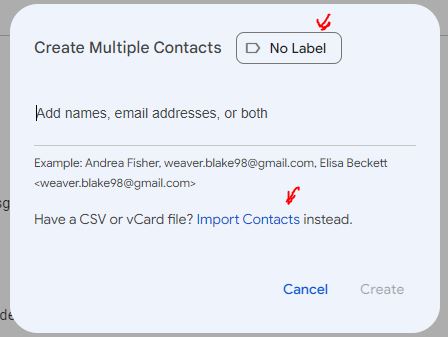
( 5 ) Up pops a Create Multiple Contacts window. At the upper right of that window you can select what existing label (contact group name) you want to apply to this new list of names, or create a new label. For this example, I created (entered) a new label (in place of “No Label”), called Close Friends. Then, towards the bottom of this window, click on Import Contacts.
Then (in the new window that pops up) select the name of the incoming CSV file, and click Import. That’s it!
The new contacts will be in your overall contact list, with the group name label applied to them. There will also be a default group label “Imported on [today’s date]” created (also applied to this bunch of contacts). You can delete that label from the list of labels (bottom left of the Contacts page), using the “Keep the Contacts” option so the new contacts don’t get erased.
( 6 ) Now you can send out emails to this whole group of contacts. If this is a more professional or sensitive situation, or if the list of contacts is unwieldy (e.g. over ten or so), you might just send the email to yourself and bcc it to the labeled group.
APPENDIX: List of all Header Entries for CSV Files, for Importing Contacts to Gmail
I listed above several header entries which could be used to tell Google what the data is in your list of contact information. This Productivity Portfolio link has more detailed information. This includes tips for using VCard file format for transferring contact information (use app like Outlook to generate VCard or CSV file, then fix header info as needed, and then import that file into Google contacts).
There is also a complete list of header entries for a CSV file, which is available as an Excel file by clicking his “ My Google Contacts CSV Template “ button. The Excel spreadsheet format is convenient for lining things up for actual usage, but I have copied the long list of header items into a long text string to dump here, to give you the idea of what other header items might look like:
Name,Given Name,Additional Name,Family Name,Yomi Name,Given Name Yomi,Additional Name Yomi,Family Name Yomi,Name Prefix,Name Suffix,Initials,Nickname,Short Name,Maiden Name,Birthday,Gender,Location,Billing Information,Directory Server,Mileage,Occupation,Hobby,Sensitivity,Priority,Subject,Notes,Language,Photo,Group Membership,E-mail 1 – Type,E-mail 1 – Value,E-mail 2 – Type,E-mail 2 – Value,Phone 1 – Type,Phone 1 – Value,Phone 2 – Type,Phone 2 – Value,Phone 3 – Type,Phone 3 – Value,Phone 4 – Type,Phone 4 – Value,Phone 5 – Type,Phone 5 – Value,Address 1 – Type,Address 1 – Formatted,Address 1 – Street,Address 1 – City,Address 1 – PO Box,Address 1 – Region,Address 1 – Postal Code,Address 1 – Country,Address 1 – Extended Address,Address 2 – Type,Address 2 – Formatted,Address 2 – Street,Address 2 – City,Address 2 – PO Box,Address 2 – Region,Address 2 – Postal Code,Address 2 – Country,Address 2 – Extended Address,Organization 1 – Type,Organization 1 – Name,Organization 1 – Yomi Name,Organization 1 – Title,Organization 1 – Department,Organization 1 – Symbol,Organization 1 – Location,Organization 1 – Job Description,Relation 1 – Type,Relation 1 – Value,Relation 2 – Type,Relation 2 – Value,Relation 3 – Type,Relation 3 – Value,Relation 4 – Type,Relation 4 – Value,External ID 1 – Type,External ID 1 – Value,External ID 2 – Type,External ID 2 – Value,Website 1 – Type,Website 1 – Value,Event 1 – Type,Event 1 – Value
I bolded the two items I actually used in my example (Name and E-mail 1 – Value), as well as a pair of entries ( Phone 1 – Type and Phone 1 – Value) as header items which you might use for including, say, cell phone numbers in your CSV file of contact information.