Arbitrary Framing & Economic Reality

Subjectivism is popular at many universities. I am not talking about the economics kind in which people have a diversity of preferences. I’m talking about the subjectivism that permits different and conflicting assertions of truth to be simultaneously correct. This is where the ‘my truth’ language enters. Having a diversity of feelings is one thing – and unavoidable. Having different practical claims about the material world is another. Many universities have embraced Descartes’s unreliability of the senses writ large. The result is that people of seeming plentiful intellectual capacity dogmatize themselves into speaking such that nothing is considered a default. Nothing “is normal”, there is only “normal for someone”.

It’s a perfectly defensible model of the world. And, as we know, models are applicable only insofar as they’re useful. The subjectivist model is great at describing the diversity of preferences and priorities. The model is bad for math and achieving material ends. Further, it can serve to hinder our understanding of worldly or social phenomena.

Here’s an example.

Consider people who don’t speak the same language. They may or may not have some other compensatory skill. For Mandarin speakers, we can rightfully say that they can’t speak or communicate as effectively with the English-speaking majority of people in the US. We can also say the converse: The English-speaking majority can’t speak Mandarin or communicate as effectively with the Mandarin-speaking minority. There’s a certain symmetrical beauty to being able to interpret reality both ways. It exercises our cerebral cortex.

However, modeling the descriptive statements as intrinsically equivalent harms our ability to sensibly understand and analyze the circumstances. Specifically, we need to talk about opportunity costs.

Consider an urban storeowner in America who speaks only Mandarin. Consider also an only-English-speaking customer who has a question about an item for sale. We can perform the same symmetrical analysis as above saying that they both speak different languages. Importantly, however, they face substantially different opportunity costs in two ways.

First, the English-speaking customer has low-cost alternatives. The language barrier need not be insurmountable. If the transaction cost of more difficult communication is adequate, then the English-speaking customer can go elsewhere relatively easily and purchase from the English-speaking storeowner down the block. They have plenty of low-cost opportunities for gains from trade. Clearly, there is nothing intrinsically advantageous about speaking English. What’s advantageous is speaking the more popular language.

By having access to the larger market, the English speaker has access to greater specialization and to more buyers and sellers. If the language difference is the only difference between two people, then the one who speaks the majority language has an economic advantage. I mean ‘economic’ in both the pecuniary and non-pecuniary sense. Speaking the majority language has the consequence of greater income. But that comes from the very real differences in costs and benefits associated with trade. If the exact same person spoke only a minority language, then their income would be lower along with their lesser access to trading partners. Therefore, while it is symmetrically true that the English speaker can’t speak Mandarin and that the Mandarin speaker can’t speak English, it is not true that they face the same opportunity costs.

Second, and probably more trivially, it may be that most English speakers never have occasion to interact with any Mandarin-only speakers. Whereas Mandarin speakers in the US have constant potential interactions with English speakers. It would therefore belie the costs and benefits to simply say that they symmetrically can’t speak the same language. Indeed, many English-speakers have no motivation nor awareness of potential Mandarin-speaking trade partners. At the same time, in the US, Mandarin speakers would very much have an awareness and occasion to interact with English speakers. While it is true that they don’t speak the same language, they differ by their access to potential trade partners who speak a different language. It wouldn’t reflect the incentives to say that the English speaker is less able to communicate with Mandarin speakers when they largely lack even the awareness of the minority language.

Conclusion

An analysis of English and Mandarin speakers in the US is not a symmetrical analysis. It doesn’t matter whether we frame English speakers has having a lower opportunity cost to trading with Mandarin speakers, or whether we frame Mandarin-speakers as having a higher opportunity cost to trading with English speakers. The economic truth is that the opportunity costs differ, no matter how we might try to equivocate about what normal is. Obviously, the above analysis isn’t specific to Mandarin and English, nor to language necessarily. While framing a circumstance with a default is an arbitrary modelling decision, asserting that two alternatives means or practices have the same opportunity cost or the same productive capacity is indefensible and often doesn’t reflect the underlying economic reality.

Medicaid Cuts Mean Credit Card Debt

My paper “Missouri’s Medicaid Contraction and Consumer Financial Outcomes” is now out at the American Journal of Health Economics. It is coauthored by Nate Blascak and Slava Mikhed, researchers at the Federal Reserve Bank of Philadelphia. They noticed that Missouri had done a cut in 2005 that removed about 100,000 people from Medicaid and reduced covered services for the remaining enrollees. Economists have mostly studied Medicaid expansions, which have been more common than cuts; those studying Medicaid cuts have focused on Tennessee’s 2005 dis-enrollments, so we were interested to see if things went differently in Missouri.

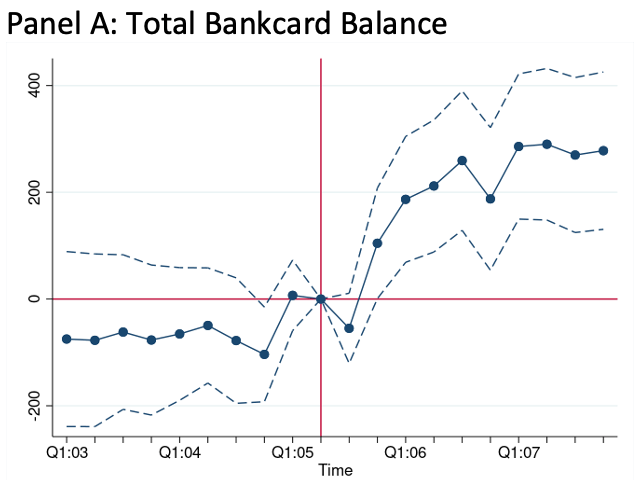
In short, we find that after Medicaid is cut, people do more out-of-pocket spending on health care, leading to increases in both credit card borrowing and debt in third-party collections. Our back-of-the-envelope calculations suggest that debt in collections increased by $494 per Medicaid-eligible Missourian, which is actually smaller than has been estimated for the Tennessee cut, and smaller than most estimates of the debt reduction following Medicaid expansions.

We bring some great data to bear on this; I used the restricted version of the Medical Expenditure Panel Survey to estimate what happened to health spending in Missouri compared to neighboring states, and my coauthors used Equifax data on credit outcomes that lets them compare even finer geographies:

The paper is a clear case of modern econometrics at work, in that it is almost painfully thorough. Counting the appendix, the version currently up at AJHE shows 130 pages with 29 tables and 11 figures (many of which are actually made up of 6 sub-figures each). We put a lot of thought into questioning the assumptions behind our difference-in-difference estimation, and into figuring out how best to bootstrap our standard errors given the small number of clusters. Sometimes this feels like overkill but hopefully it means the final results are really solid.

For those who want to read more and can’t access the journal version, an earlier ungated version is here.

Disclaimer: The results and conclusions in this paper are those of the authors and do not indicate concurrence by the Agency for Healthcare Research and Quality or the US Department of Health and Human Services. The views expressed in this paper are solely those of the authors and do not necessarily reflect the views of the Federal Reserve Bank of Philadelphia or the Federal Reserve System. Any errors or omissions are the responsibility of the authors.

Younger Generations Have Higher Incomes Too (and it’s probably not explained by the rise of dual-income families)

Regular readers know that I’ve written numerous times about the wealth levels of younger generations, such as this post from last month. Judged by average (and usually median too) wealth, younger generations are doing as well and often better than past generations. This is not too surprising, if you generally think that subsequent generations are better off than their parents, but many people today seem to think that progress has stopped. The data suggest it hasn’t stopped!

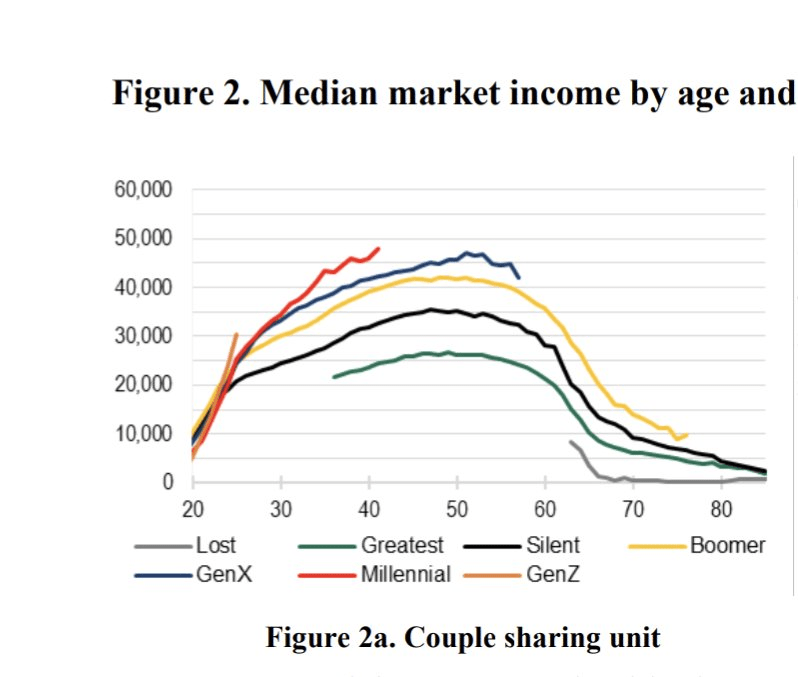
Now there’s a great new paper by Kevin Corinth and Jeff Larrimore which looks at not wealth but income levels by generation. The look at income in a variety of different ways, including both market income and post-tax/transfer income. But the result is pretty consistent: each generation has higher incomes (inflation adjusted) than the previous generation. Here’s a typical chart from the paper:

Continue reading →

Bride Who Called Off Wedding Donates $15,000 Reception to Special Needs Families; and Other Good News.

My eye was caught my a recent random headline, “Bride Donates $15,000 Reception to Special Needs Families After Calling off Her Wedding”:

In the true definition of a worst-case scenario, an unnamed California bride-to-be is reported to have called off her entire non-refundable wedding reception worth $15,000, after learning something about her fiance.

But…she took the disaster and turned it on its head, donating the reception party complete with dinner, dessert, drinks, DJ, dancing, and photo booth to a non-profit called Parents Helping Parents which provides community support to parents with children who have special needs.

…Organizers at PHP sent out invitations for the “Ball for All” and had all the seats reserved 48 hours before the event. … “Nearly everyone [there] was a young adult with special needs, their parent or a member of the care team,” Daane said. “Their joy and delight really told the story about how special and unique this event was—the moment the ballroom was opened, and we all filed into a beautiful candlelit room with tables draped in white linen.”

Yay!

This cheering item is on the “Good News Network”, which I had never heard of before. Other headlines on this site include:

Irishman Whips Out Fiddle to Entertain Passengers in Flight–and People Dance a Jig in the Aisle (WATCH)

Singing or Playing Music Throughout Life is Linked with Better Brain Health While You Age

and

She’s a Pet Detective Who’s Tracked Down and Reunited 330 Lost Dogs with Owners for Free–Using Thermal Imaging.

 I think it is great to publicize such civic acts. Let’s make this the new normal.

Does GPT-4 Know How High the Alps Are?

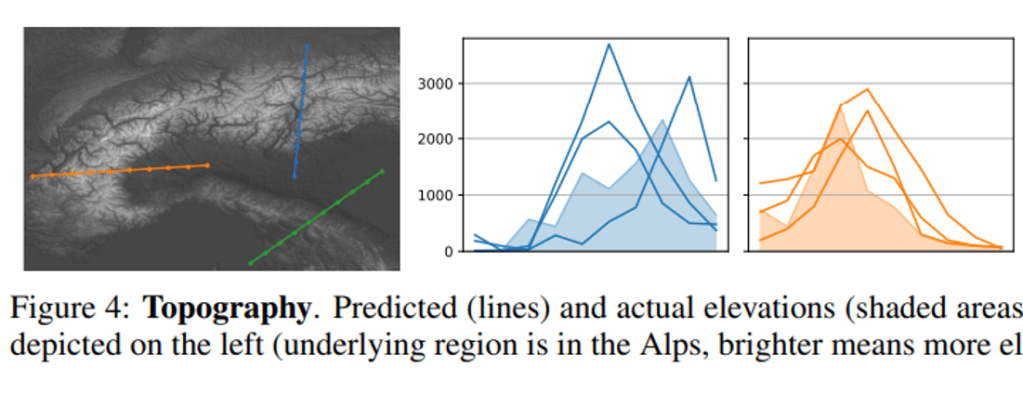
I’m getting ready to give some public local talks about AI. Last week I shared some pictures that I think might help people understand ChatGPT, specifically:

My first thought is that GPT-4 was giving incorrect estimates of the heights of these mountains because it does not actually “know” the correct elevations. But then a nagging question came to mind.

GPT has a “creativity parameter.” Sometimes, it intentionally does not select the top-rated next word in a sentence, for example, in order to avoid being stiff and boring. Could GPT-4 know the exact elevation of these mountains, and it is just intentionally being “creative,” in this case?

I do not want to stand up in front of the local Rotary Club and say something wrong. So, I went to a true expert, Lenny Bogdonoff, to ask for help. Here is his reply:

Not quite. It’s not that it knows or doesn’t know, but based on the prompt, it’s likely unable to parse the specific details and is outputting results respectively. There is a component of stochastic behavior based on what part of the model weights are activated.

One common practice to help avoid this and see what the model does grasp, is to ask it to think step by step, and explain its reasoning. When doing this, you can see the fault in logic.

All that being said, the vision model is actually faulty in being able to grasp the relative position of information, so this kind of task will be more likely to hallucinate.

There are better vision models, that aren’t OpenAI based. For example Qwen-VL-Max is very good, from the Chinese company Alibaba. Another is LLaVA which uses different baselines of open source language models to add vision capabilities

Depending on what you are needing vision for, models can be spiky in capability. Good at OCR but bad at relative positioning. Good at classifying a specific UI element, but bad at detecting plants, etc etc. 

Joy: So, I think I can tell the Rotary Club that GPT was “wrong” as opposed to “intentionally creative.” I think, as I originally concluded, you should not make ChatGPT the pilot of your airplane and go to sleep when approaching the Alps. ChatGPT should be used for what it is good at, such as writing the rough draft of a cover letter. (We have great “autopilot” software for flying planes, already, without involving large language models.)

Another expert, Gavin Leech, also weighed in with some helpful background information:

  • the creativity parameter is known as temperature. But you can actually radically change the output (intelligence, style, creativity) by using more complicated sampling schemes. The best analogy for changing the sampling scheme is that you’re giving it a psychiatric drug. Changing the prompt, conversely, is like CBT or one of those cute mindset interventions.
  • For each real-name model (e.g. “gpt-4-0613”), there’s 3 versions: the base model (which now no one except highly vetted researchers have access to), the instruction-tuned model, and the RLHF (or rather RLAIF) model. The base model is wildly creative, unhinged, but the RLHF one (which the linked researchers use) is heavily electroshocked into not intentionally making things up (as Lenny says).
  • It’s currently not usually possible to diagnose an error – the proverbial black box. My friends are working on this though
  • For more, note OpenAI admitting the “laziness” of their own models. the Turbo model line is intended to fix this.

Thank you, Lenny and Gavin, for donating your insights.

A Measure of Dissimilarity

I recently learned about an interesting statistic for social scientists. It’s called the “Dissimilarity Index”. It allows you to compare the categorical distribution of two sets.

Many of us already know how to compare two distributions that have only 2 possible values. It’s easy because if you know the proportion of a group who are in category 1, then you know that 1-p will be in category 2. We can conveniently denote these with values of zero and one, and then conduct standard t-tests or z-tests to discover whether they are statistically different. But what about distributions across more than two possible categories?

Continue reading →

Historical State GDP Data

Data on Gross State Product prior to 2017 has disappeared from the main page of the Bureau of Economic Analysis. It is also gone from some third party hosts like FRED. It turns out BEA is in the middle of revising how they calculate state GDP; they have the new version done back to 2017, and took down the older inconsistent estimates until they can recalculate them. After that, they tell me they will repost pre-2017 state Gross Domestic Product:

In the mean time, they offer some messy and seemingly incomplete versions of pre-2017 GDP here, and you can find 1980-2021 state GDP (along with many other nice variables) in a nice panel from the University of Kentucky Center for Poverty Research’s National Welfare Data.

You can find more details on the actual changes BEA is making to how they calculate GDP here. Most changes seem relatively minor for states, but might have more impact on the measured relative size of industries. For instance, “equity REITs will be reclassified from the funds, trusts, and other financial vehicles industry to the real estate industry, while mortgage REITs will remain classified as funds, trusts, and other financial vehicles”.

Why Was Federal Tax Revenue Down in 2023?

The year 2023 was a pretty good one for the economy, whether judged by the labor market or economic growth. Despite this good economic growth, total receipts of the federal government were down about 7 percent from 2022 (note: I’m using calendar years, rather than fiscal years). Here’s a chart (note: in NOMINAL dollars) of total federal revenue since 2009:

I want to stress that these are nominal dollars (there, I’ve said it three times, hopefully there is no confusion). Nominal dollars are usually not the best way to look at historical data, but for purposes of looking at recent government budgets, sometimes it is. Especially when revenue is declining: if I adjusted this for inflation, the decline in 2023 would be even larger!

You’ll notice also that the decline in 2023 is even larger than the decline in 2020, the height of the pandemic when many people were out of work due to government regulations and changes in consumer behavior. The 2023 decline is big!

So, what the heck in going on with federal revenue in 2023?

Continue reading →

Why don’t Americans migrate anymore?

Inter- and intratstate migration has collapsed within the United States over the last 60 years.

From “Understanding migration aversion using elicited counterfactual choice probabilities” Kosar, Ransom, and van der Klauw, Journal of Econometrics (2022).

This observation has been lurking in the not-completely-the-background of labor economics for 20 years. The best summary of the literature, by Jia et al, came out in the JEL last year. It’s a very useful and relatively complete treatment. I think a lot about migration these days, mostly asking about the determinants of our reservation wage of migration i.e. how much of a wage increase would someone have to offer you to pick up and move to an entirely new community.

If we take the above figure at face value, it would appear the reservation wage of migraton has increased for Americans. Quite a bit, actually. Of course, it is also possible that American’s no longer have to migrate to find a better job or wage, but that seems a hardly universal phenomenon over that last 50 years. Work from home has only had traction for a decade now at best. Labor markets aren’t as concentrated as they perhaps once were, loosening the monopsonistic lid a bit in a lot of markets, but at the same time the labor share of revenues hasn’t increased, in fact it’s decreased on average. So why aren’t people moving? I have some narrow, testable, answers that I am pursuing as research projects, but I also have a broad hypothesis that seems supremely untestable for the moment, sitting as it were in that thinkpiece uncanny valley between narrow research and podcast cheaptalk.

The concept of diminishing returns is an easy intuition to adopt. We all know the first bite of dessert is the best, the last the one most encumbered with regret. Economic growth remains a miracle, but it’s still true that nothing gained at the margin of the modern developed world will ever compete with those first steps out of subsistence. Very nearly every form of household capital and consumption in the modern work is characterized by some amount of diminishing returns, but that doesn’t mean they are diminishing at the same rate.

There are some goods for which there are few, if any substitutes. Demand for these special goods can be quite inelastic – we’re willing to sacrifice a lot to maintain a certain level of consumption. There are also goods that are quite complementary with one another, their value to us increasing as they are bundled together. Complements are powerful, putting together the right mix of consumption is quite literally the recipe for a better life. Complements, however, are often part and parcel to a cautionary tale. If something is a powerful complement to everything else in your life, we might find ourselves saying things like “I can’t live without it.” No amount of wealth in the world can survive being multiplied by zero.

There are few, if any, substitutes for friends, family, and our broader social network. Some goods cannot be consumed alone. If the sociological literature is to be believed, Americans are lonelier than ever. Both our deepest and most casual friendships have diminished in number. Relationships with neighbors are nonexistent, our ties to communities at a premium. That might, at first blush, make it sound like moving should be less costly– why stick around to maintain relationships that you don’t have. But on the other hand, if new relationships are harder to form than previously, then the relationships you already have are worth more than ever, to be protected jealously. Your only friend is, by definition, your best friend. No one wants to move away from their best friend.

Putting it all together, if personal relationships are an inelastic demand good that is complementary with a large chunk of our consumption bundle, then the price, the shadow price, we are willing to pay for it is going to go through the roof in the face of a negative supply shock. In a world where relationships are sudenly at a premium, you will be willing to forego a lot of additional income in order to preserve a small network in which you have a lot of social capital.

In two weeks half the country is going to be watching the Superbowl with a 3 or 4 friends, maybe 10 or 20. Thanks to innovation and economic growth, most people will be watching it on a 55 inch high definititon television with decent food and beverages. What about game would change if the host got a 20% raise? The TV might get a a little bigger, the snacks less fried, the beer more imported. What if the host moved two years ago? Would they have friends close enough to invite over? $15,000 worth of catering is a poor substitute for having someone to high-five.

The more I think about our lives and how little economic pressure, survival pressure, there is to find a 10% higher wage in the modern developed world, I’m surprised anyone migrates at all.