Warsh’s Low/No Guidance Approach at Fed Makes Market Participants Nervous – – Which May Be a Good Thing

Under Jerome Powell, a typical FOMC meeting had become almost a market event in itself. Traders didn’t just care about the rate decision. They dissected every word of the statement, every sentence of the press conference, and especially the “dot plot,” looking for clues about where rates might be six months or a year from now. The Fed wasn’t simply setting monetary policy—it was guiding expectations. Markets often moved as much on hints about future decisions as on the decision itself.

The first two FOMC meetings under Kevin Warsh have felt very different. The dot plots are gone. Forward guidance has largely disappeared. Instead of trying to signal the likely path of policy, Warsh has repeatedly stressed that the Fed will respond to incoming data when it arrives, not commit itself to forecasts that could prove wrong. At his latest press conference, he described avoiding forward guidance as “prudent” given current uncertainty, while reminding reporters that “There is no soft or alternative inflation target—only 2%.”

This is a huge change in communication style, which is having real world consequences.

Warsh long argued that forward guidance can box policymakers into decisions based on yesterday’s forecasts instead of tomorrow’s realities. That is, once their tentative plans had been put out in public, there was a psychological bias among Fed members to lock in on those projections, which would inhibit their ability to rationally interact with the most recent data and situation. So now, rather than telling markets what the Fed expects to do, he wants investors to make decisions based on fundamental economic conditions, knowing that the central bank will react only after the facts justify it. At the latest FOMC meeting he said, “Market participants are learning to play the ball, not the referee—and market prices will continue to respond in the direction and magnitude they see fit. This is, in my view, a change for the better—and we are just getting started.”

That approach chips away at what investors have come to call the “Fed Put”—the belief, built up since the 2008 financial crisis, that the central bank will fairly quickly and forcefully step in to support markets whenever things get rough.

If that belief fades, financiers may think twice before taking excessive risks. Leverage becomes more dangerous if there is less confidence that easier monetary policy will quickly arrive to cushion losses. Risk premiums may better reflect actual economic uncertainty rather than expectations of future Fed support. That is the possible good side of Warsh’s more hands-off approach. Ideally, business people will exercise more prudence on their own, lessening the odds of financial catastrophes that would require Fed intervention.

On the other hand, markets hate uncertainty, and less guidance means more volatility around Fed meetings. I think Powell tried to use sheer talking (jaw-boning) as a tool to influence market rates, lessening the need for the Fed to actually employ its blunt instruments there. Warsh seems to have taken that tool off the table.

Also, I think some (not all) the causation for the rise in 30-year Treasury bonds to twenty-year highs, and of home mortgage rates to one-year highs accrues to Warsh. First, by eliminating dot plots and forward guidance, he has increased uncertainty about the future path of policy. Investors can no longer confidently assume the Fed will ease at the first sign of economic weakness. That uncertainty can raise the term premium, pushing long-term yields higher.

Second, if markets believe the “Fed Put” is weaker, they may demand higher yields to hold long-term bonds because they perceive less protection from adverse economic or financial shocks. In other words, investors require more compensation for risk.

Whether today’s higher long-term rates are a healthy reflection of economic realities, or an unhealth drag on growth, is a matter of debate.
After the Crash: Silver Clawing Back Up After Epic Bust Last Week

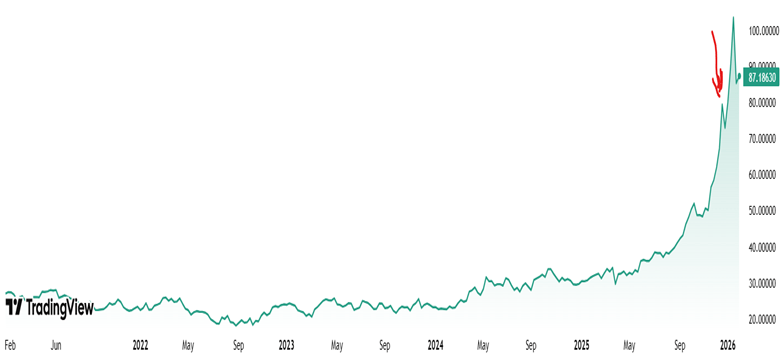
A month ago (red arrow in 5-year chart below), I noticed that the price of silver was starting into a parabolic rise pattern. That is typical of speculative bubbles. Those bubbles usually end in a bust. Also, the rise in silver price seemed to be mainly driven by retail speculators, fueled by half-baked narratives rather than physical reality.

Five-year chart of silver prices $/oz, per Trading View

So I wrote a blog post here last month warning of a bubble, and sold about a quarter of my silver holdings. (I also initiated some protective options but that’s another story for another time.) I then felt pretty foolish for the next four weeks, as silver prices went up and up and up, a good 40% percent over the point I initially thought it was a bubble. Maybe I was wrong, or maybe the market can stay irrational longer than you can stay solvent, per J. M. Keynes.

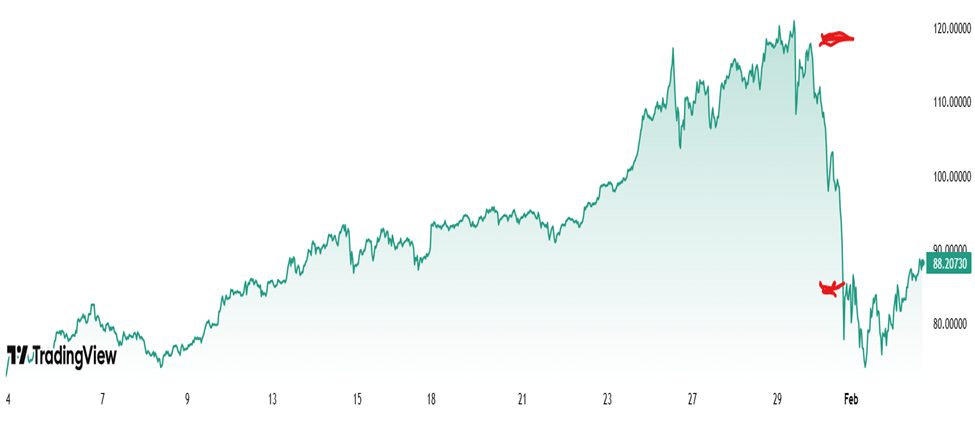
When the crash finally came, it was truly epic. Below is a one-month chart of silver price. The two red lines show silver price at the close of regular trading on Thursday, January 29 (115.5 $/oz), and at the close of trading on Friday, January 30 (84.6 $/oz):

This is a drop of nearly 30% in one day, which is a mind-boggling move for a major commodity. Gold got dragged down, too:

These aren’t normal moves. Over roughly the past 25+ years (through 2025), gold’s price has changed by about 0.8% per day on average (in absolute percentage terms). Silver, being more volatile, has averaged around 1.4–1.5% per day. If you’re scoring at home, that’s about a 13 Sigma move for Gold and 22 Sigma move for Silver! You’re witnessing something that shouldn’t happen more than once in several lifetimes…statistically speaking. Yet here we are.

After the fact, a number of causes for the crash were proposed:

  • The nomination of Kevin Warsh as the next Federal Reserve Chair.  Warsh is perceived as a hawkish policymaker, leading investors to expect tighter monetary policy, higher interest rates, and a stronger U.S. dollar—all of which reduce the appeal of non-yielding assets like silver. 
  • Aggressive profit-taking after silver surged over 40% year-to-date and hit record highs near $121 per ounce. 
  • Leveraged positions in silver futures were rapidly unwound as prices broke key technical levels, triggering stop-loss orders and margin calls. 
  • CME margin hikes (up to 36% for silver futures) increased trading costs, forcing traders to cut exposure and accelerating the sell-off. 
  • Extreme speculation among Chinese investors, leading the Chinese government to clamp down on speculative trading. (And presumably Chinese solar panel manufacturers have been complaining to the government about high costs for silver components).

What happens next?

Silver kept falling to a low of 72.9 $/oz in the wee hours of February 2, a drop of 40% percent from the high of 120.8 on Jan 26. However, it looks to my amateur eyes like the silver bubble is not really tamed yet. For all the drama of a 22-sigma crash one day crash, about all that did was erase one months’ worth of speculative gains. The charts above are showing that silver is clawing its way right back up again.  It is very roughly on the trend line of the past six months, if one excludes the monster surge in the month of January.

There is a saying among commodities traders, that the cure for high prices is high prices. This means that over time, there will be adjustments that will bring down prices. In the case of silver, that will include figuring out ways to use less of it, including recycling and substitution of other metals like copper and aluminum. However, my guess is that the silver bulls feel vindicated by the price action so far, and will keep on buying at least for now.

Disclaimer: As usual, nothing here should be regarded as advice to buy or sell any security.