Yesterday Jeremy discussed what spiking car prices mean for overall inflation.
Today I’ll discuss the outlook for car prices themselves, based on what I heard at the Philly Fed’s conference on auto lending yesterday. Some (approximate) quotes:
The used market is red hot
Used prices are likely to stay elevated for a few years
Because used prices are so high, “If you can find the car you are looking for new right now, there’s a good chance it makes sense to buy it instead of going used.” But it could be hard to find that new car you want because inventories are so low, and even then you probably won’t be able to bargain the price down like you normally would- “75% of new cars now sell for MSRP or above, vs 36% last year”
The average new car now sells for $40k, partly because SUVs are increasingly popular, and partly to bother those who care about financial responsibility, like fellow Temple Econ PhD Adam Ozimek:
Spending $40,000 on a car seems like the kind of thing to me that, intuitively, you do when you have like a couple million in wealth and make $400,000 a year. But absolutely normal people do it all the time! Blows me away
Because of manufacturing disruptions from Covid and the chip shortage, “We’re at least a year out before we start to restock to normal dealer inventory levels” in the new market. Supply in the used market could stay low for 4-5 years because of the lower production of new cars and lower turnover of existing ones. Normally cars coming off lease & out of rental car fleets are a big sources of used cars for sale, but fleet purchases & leases are down from 40% of new car purchases to 25%. Reposessions, another source of used cars, actually decreased slightly through Covid despite the huge spike in unemployment.
All in all, its a good time to own a car and a bad time to try to buy one, and this state of affairs could persist for years absent an unexpected drop in demand or spike in supply.
Electric cars, though, seemed poised to take over much more of the market- the forecast was about 1/3 of new sales by 2030, driven by improvements in the technology, continued subsidies to new EV purchases & EV infrastructure, and car companies offering electric models in popular categories like SUVs and trucks where they are currently rare.
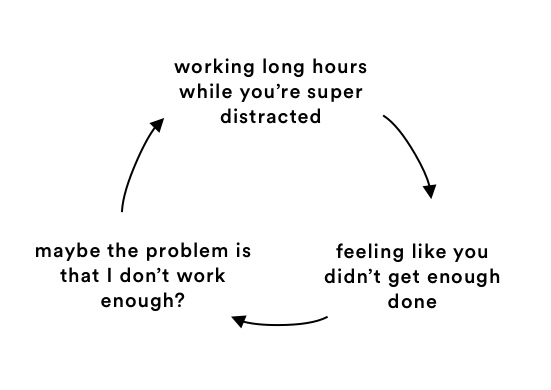
Many people get the idea that they should be working all the time. Certainly many academics do, which for us means a continuous internal reminder that “you should be writing”.
I thought this way in grad school but I don’t anymore. I now almost never work on nights & weekends, and often not on afternoons. Yet I get just as much work done, maybe more, and I’m much happier about it. How can this be?
This post from Ava provides a great explanation. Its very short and you should read it, but I think it illustrates best through its literal illustrations:
Today is a good example. I’m writing this at noon, having just finished the revisions requested by a journal after 3 hours of solid work. Now, rather than start revising the next article & doing a bad job of it, I’ll take the rest of the day off. Real original thought is hard- I know I can do it for about 3 hours on a typical day, I have no one to impress by pretending to work longer, and one way or another the output will speak for itself. As remote work grows, this ability to do the real work and then stop rather than fill time “working” should be available to more people outside of academics.
If you want to change how a field works, you have a few options. You can do what you want to see more of, but you are only one person, and perhaps not the one best equipped to make things better. Or you can encourage others to work differently- but why would they listen to you?
Academics often serve as peer reviewers for the work of others. If a reviewer recommends that a paper be rejected, it usually is; if you recommend specific minor changes they usually get made. But you can’t really tell people that they should work on a totally different topic. Journal editors for the most part simply have a scaled-up version of the powers of peer reviewers to steer the field. But unlike reviewers, their positions are public and fairly long-lasting. This means they can credibly say “this is the sort of work I’d like to see more of- if you do this kind of work, there’s a good chance I’ll publish it”.
This is part of why I’ve been hoping to be a journal editor some day, and why I’m excited to be guest-editing for the first time: a special issue on Health Economics and Insurance for the Journal of Risk and Financial Management. The description notes:
Yesterday, co-blogger Jeremy asked “Should Andrew Yang Wait To Concede?” in the New York City mayoral race. He argued that while Yang finished 4th in 1st-place primary votes, the new Ranked Choice Voting system meant he could still win. This is of course true in theory- but today I argue it is very unlikely in practice.
I say this not because I have scrutinized all the polls to predict the exact distribution of 2nd- and 3rd-place votes, or because I think I know more than Jeremy about political science or New York. Instead, any time I’m wondering about whether something will happen and I don’t have a strong opinion based on my own knowledge, I simply check what markets have to say. In this case, there are prediction markets bearing on this exact issue. The odds from PredictIt, shown below, have Adams (who finished with the most 1st-place votes, 32%) as the heavy favorite, with Yang reduced to an approximately 1% chance of winning.
But Jeremy is right to highlight that the Ranked-Choice system makes it less obvious who will win. You can see PredictIt traders still think that Garcia, who finished with 19% of 1st-place votes, is substantially more likely to win than Wiley, who finished with 22% (though the new system didn’t matter in the Republican primary, where Sliwa won with a clear majority of 1st-place votes).
Crypto-based betting platform Polymarket has actually closed their market for Yang already, declaring that he lost, though they agree with PredictIt that the overall election isn’t over and that Garcia still has a real chance despite coming in 3rd for 1st-place votes.
Of course, prediction markets aren’t perfect- they are certainly less accurate (easier to beat) than the stock market, as my track record of betting in both shows. But they make for a great first approximation on subjects you don’t know well, and if you think you do know better, they offer you the chance to make money and to make the odds more accurate. If you think Yang will still win, you can go bet on PredictIt and potentially 100x your money. Or if you think this ranked choice stuff is nonsense and Adams obviously won, you can pick up an easy 10% return. Or if you’re like me in this case, you can stay out of it, take a quick glance at the markets, and get a good idea of what is likely to happen without having to read the news or the pundits.
For population to be steady or rising, the average women needs to have at least two kids. In almost every rich country- including the United States, all of Europe, and all of East Asia- this isn’t happening. In the extreme case of South Korea, where total fertility averages about one child per woman, the population will fall by half each generation. If this were to go on for 10 generations, South Korea would go from a country of 50 million people- larger than any US state- to one of 50 thousand people, far smaller than any US state. This sounds crazy and I don’t expect it will actually happen- but I can’t say what exactly will stop it from happening.
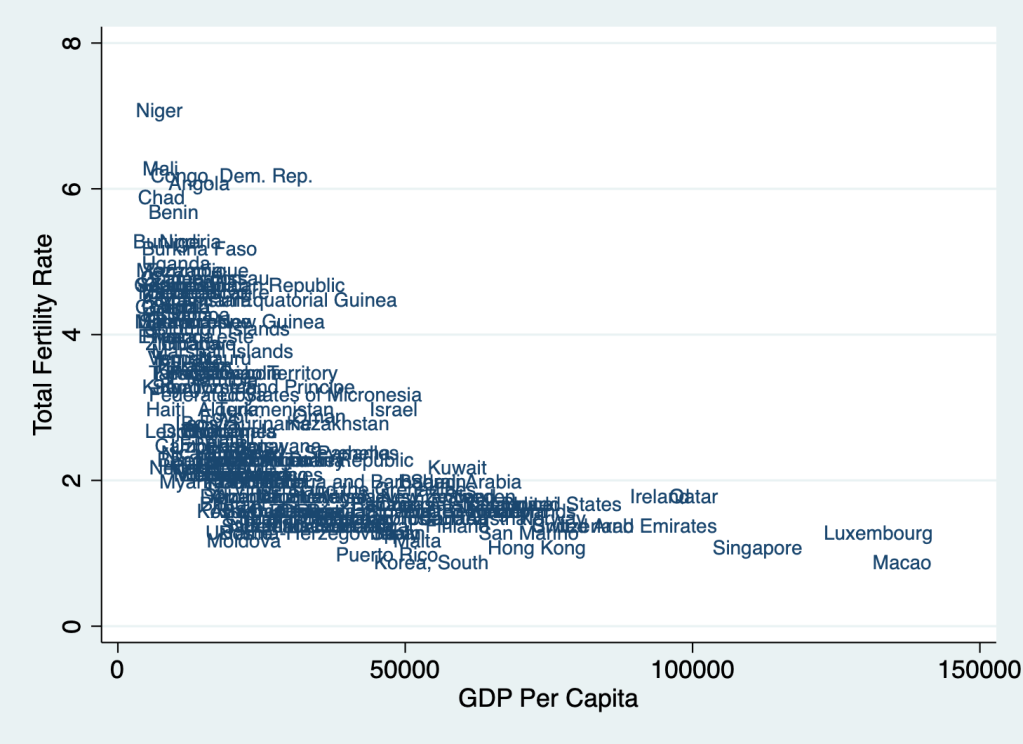
Global population growth has fallen from a peak of 2.1% per year to the current 1%, and is expected to fall to 0 by 2100. The remaining population growth will happen in poor countries, then stop for the same reasons it did in rich countries- the demographic transition from poverty, argicultural work, and high infant mortality to high incomes, high education, and low infant mortality. As the graph below shows, higher income is an incredibly strong predictor of low fertility- and so if economic growth continues, we should expect fertility to continue falling. But where does it stop?
2019 TFR from Population Reference Bureau vs 2019 PPP-adjusted GDP Per Capita fron World Bank
Some have theorized a “J-curve” relationship, where once incomes get high enough, fertility will start rising again. You can see this idea in “Stage 5” of Max Roser’s picture of the demopgraphic transition here:
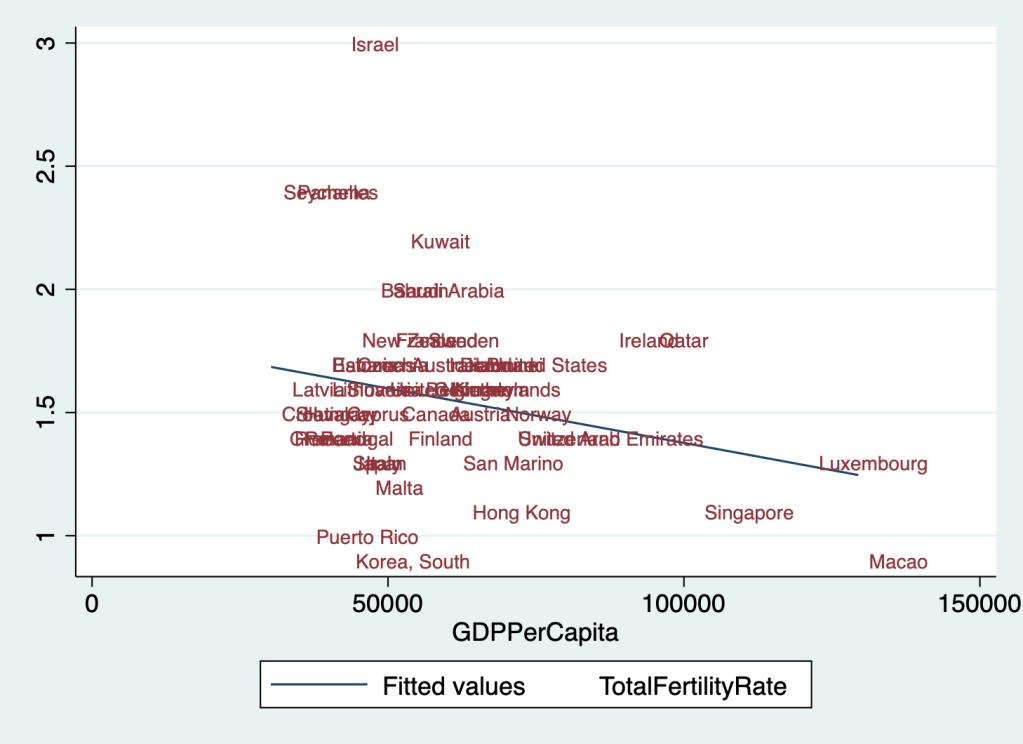
This makes sense to me in theory. As countries get richer, desired fertility (the number of kids each woman wants to have) has fallen, but realized fertility (the number of kids each woman actually has) has fallen faster. In a typical rich country women would like to have 2-2.5 kids, but actually ends up having about 1.5. There are many reasons for this, but some are clearly economic- the high cost of goods and services that are desired by rich-country parents, like child care, education, and spacious housing near high-paying jobs. Perhaps in a rich enough country all these could be obtained with a single income (maybe even from a part-time job). But it seems we aren’t there yet. Even zooming in on higher-income countries, higher incomes still seem to lead to lower fertility.
TFR vs GDP Per Capita in countries with GDP Per Capita over 30k/yr
The only rich countries with fertility above replacement are Panama and the Seychelles (barely meeting my 30k/yr definition of rich), Kuwait (right at replacement with 2.2 kids per woman), and Israel- the biggest outlier, with 3 children per woman at a 42k/yr GDP. This hints that pro-fertility religious culture could be one way to stay at or above replacement. But in most countries, rising wealth seems to drive a decline in religiousity along with fertility. Will this trend eventually come to Israel? Or will it reverse in other countries, as more “pro-fertility” beliefs and cultures (religious or otherwise) get selected for?
To do one more crazy extrapolation like the disappearance of South Korea, the number of Mormons is currently growing by over 50% per generation from a base of 6 million while the rest of the US is shrinking. If these trends continue (and setting aside immigration), in at most 10 generations the US will be majority-Mormon. Again, I don’t actually expect this, but I don’t know whether it will be falling Mormon fertility, non-Mormon fertility somehow rising back above replacement, or somethingelse entirely that changes our path.
What would a secular pro-fertility culture look like? For my generation, I see two big things that make people hold back from having kids: a desire to consume experiences like travel and nightlife that are harder with kids, and demanding careers. I see more potential for change on the career front. Remote work means that more quality jobs will be available outside of expensive city centers. Remote work, along with other technological and cultural changes, could make it easier to work part-time or to re-enter the work force after a break. Improving educational productivity so that getting better-education doesn’t have to mean more years of school would be a game-changer; in the short run I think people will spend even more time in school but I see green shoots on the horizon.
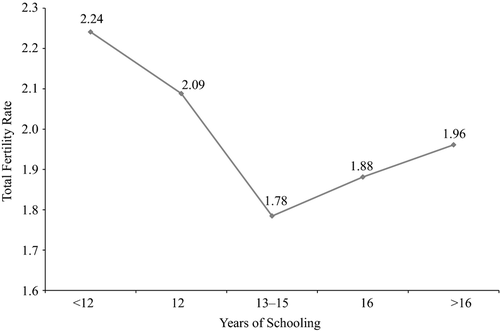
Looking within the US, we are just beginning to see what looks like the “J-curve” happening. Since about the year 2000, women with advanced degrees began to have more children than those with only undergraduate education (though still fewer than those with no college, and still below replacement):
From Hazan and Zoabi 2015, “Do Highly Educated Women Choose Smaller Families?”
We see a similar change with income. In 1980 women from richer households clearly had fewer children, but by 2010 this is no longer true:
Fertility of married white women, from Bar et al. 2018, “Why did rich families increase their fertility? Inequality and marketization of child care”
The authors of the papers that produced the two graphs above argue that this change is due to “marketization”, the increasing ability to spend money to get childcare and other goods and services that make it easier to take care of kids. If this is true, it could bode well for getting back to replacement- markets first figure out how to make more excellent daycare and kid-related gadgets, then figure out how to make them cheap enough for wide adoption.
The Endless Frontiers Act passed the Senate Tuesday in a bipartisan 68-32 vote. What was originally a $100 Billion bill to reform and enhance US research in ways lauded by innovation policy experts went through 616 amendments. The bill that emerged has fewer ambitious reforms, more local pork-barrel spending, and some totally unrelated additions like “shark fin sales elimination”. But it does still represent a major increase in US government spending on research and technology- and other than pork, the main theme of this spending is to protect US technological dominance from a rising China. One section of the bill is actually called “Limitation on cooperation with the People’s Republic of China“, and one successful amendment was “To prohibit any Federal funding for the Wuhan Institute of Virology“
My article, coauthored with Sarah Kerrigan and published last week, tries to answer the question. In short, the answer seems to be yes- cohabitation before marriage is associated with a 4.6 percentage point increase in the rate of marital dissolution. This is in line with much of the previous literature, which notes one big exception- choosing right (or getting lucky) the first time: “cohabitation had a significant negative association with marital stability, except when the cohabitation was with the eventual marriage partner”.
But we found some even more interesting facts while digging through the National Survey of Family Growth.
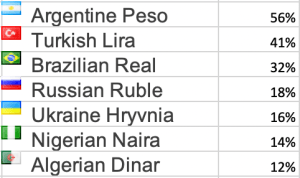
The 2007-9 Financial Crisis turned Iceland into a major tourist destination, as a newly cheap currency combined with affordable flights and natural beauty. For anyone with plenty of time and a moderate amount of money, chasing the newly-cheap destination seems like a good travel strategy.
Since January 2020, here are the countries where the US dollar has gained the most vs the local currency:
Texas is one of the most regulated states in the country.
This is one of the surprises that emerged from the State RegData project, which quantifies the number of regulatory restrictions in force in each state. It turns out that a state’s population size, rather than political ideology or any thing else, is the best predictor of its regulations.
This is what I found, with my coauthors James Broughel and Patrick McLaughlin, when we set out to test whether a previous paper (Mulligan and Shliefer 2005) that showed a regulation-population link held up when we used the better data that is now available. We found that across states, a doubling of population size is associated with a 22 to 33 percent increase in regulation.
US housing prices shot up during the pandemic. People spending all day at home wanted bigger houses, and the Fed fueled their demand with low interest rates. But home owners didn’t want to sell- the total number of homes on the market is less than half what it was a year ago. This combination of rising demand & falling supply has sent prices way up & cut the time homes spend on the market.
Contrary to popular belief, its actually rare for economists to make market forecasts and most of us aren’t especially well-equipped to do so- but I’m going to try anyway! I think home prices will almost certainly stop growing so quickly, and may actually fall, within two years.
Why? The end of the pandemic, the rise of new construction, and the end of low interest rates.