I have seen it many times. It comes from this Washington Post article, but it seems to go viral on Twitter about every 6 months or so.
The implication of the chart seems to confirm what many young people feel in their bones: Boomers had it much easier, and it’s getting harder and harder for later generations to catch up and build wealth. For many the graph… explains a lot, as one recent viral Tweet put it (in the weird world of social media, 5 short words and a recycled chart are all it takes for 20,000 retweets).
But wait. A few questions probably come to mind. For example, when Boomers were young they comprised a much larger share of the population. The original article makes an attempt to adjust for this, by calculating a few ratios towards the end of the article. However, there’s a much more straightforward way to adjust for this, which also nicely fits into a chart: put wealth in per capita terms!
If we do that, here’s the chart we get (also, of course, adjusted for inflation).
Data is for 1989-2021 from the Federal Reserve’s Distributional Financial Accounts, but only the first quarter is available right now for 2021. For 1989, it is the average of the third and fourth quarters. Population data comes from Census single-year of age estimates for various years. 2020 and 2021 population estimated using growth rate from 2010-2019.Continue reading →
When there’s only one employer in town who hires for jobs like yours, they have labor-market power, and can pay less and have worse working conditions than a competitive firm would. Economists call this “labor market monopsony” but I like the term “employer power”, which is simpler and makes sense when there are a few employers as well as when its literally just one. This keeps down the wages of machinists at the only factory in town, nurses at the only hospital in town, and professors at the only university in town.
Of course, workers in this situation could always move and get a better job elsewhere, and this does put some limits on employer power, but many workers have strong preferences to stay in their home, which means the balance of power is with the employers- or at least, it has been.
The growth of remote work means that workers can get jobs all over the world (or at least all over nearby time zones) without having to leave their town. Which means that monopsony is over, at least for jobs where remote work is possible.
I’m going up for tenure at my college soon, meaning that by next June they will tell me either that I have a job for life or that I’m fired. This “up or out” system naturally causes a lot of anxiety for professors. Partly this is because many professors’ identities are wrapped up in our jobs to an unnecessary and unhealthy extent, and so we take it as a judgement on our worth as human beings. But partly there was always the very practical problem that failing tenure almost certainly meant you would either need to move, accept a substantially worse job, or both.
The thinness of the academic labor market means that unless you live in a major city, its probably the case that no university nearby is hiring tenure-track academics in your subfield this year; and even if you are in a major city, there are probably only 2-3 searches in your field, and they will be so competitive that you almost certainly won’t get the job. To have a real chance at another good academic job, people need to apply nationwide (when I got my first job I sent out 120 applications all over the country to get 1 offer). Getting another job locally generally means taking a job with much worse pay, worse conditions, or both- like high school teacher, adjunct professor, or entry-level business analyst. Those in relatively practical fields like economics were able to get decent jobs outside of academia (PhD economists in private sector and government jobs typically earn better salaries than academics, at the cost of working more hours with less freedom), but such jobs were plentiful only in a few major cities (DC, SF, NYC, Boston), which usually still meant moving. Even in a mid-sized state capital like Providence, I don’t think I’d have an easy time finding something here- or I didn’t think so, until remote work became ubiquitous last year.
Now I won’t be losing any sleep over the possibility of losing my job next year. Partly I think my odds of getting tenure are good, but even a 1% chance of losing my job would have been worrisome in the pre-remote world. Now instead of worrying I just think about the huge range of opportunities in tech, finance, consulting, business, think tanks, and even government. Remote also addresses one big reason I ignored those jobs in the first place and only applied in academia- flexibility. I didn’t want to be stuck in an office 40+ hours/wk; I wanted to be able to pick my kids up from school. Now flexible hours and the ability to be evaluated on output rather than time spent at the office seem to be increasingly common.
To the extent that remote work puts a dent in employer power we would expect to see higher employment, higher wages, and fewer people feeling trapped in their jobs. We’ve seen all of these in 2021- quits in particular are at an all-time high, a good sign that workers don’t feel trapped- though much this could simply be due to the rapid economic recovery. The real test will come when we see how much this is sustained past the initial recovery, and whether it is mainly in remote-able jobs or is a broad improvement.
How well do masks work at preventing disease transmission? This is a question that many of us have been asking throughout the pandemic. I have been trying to read as much about mask effectiveness as I can (for example, here’s a Tweet of mine from way back in June 2020). I think the bottom line is that, if you want really good RCTs of mask use during the COVID pandemic, there is surprisingly little evidence in any direction. But there are lots of studies, less well done but still OK, suggesting that masks do provide some protection.
I don’t want to wade into all of that research here, because Bryan Caplan has been doing that lately himself. His reading of the literature is that masks aren’t a silver bullet, but he suspects “that masks reduce contagion by 10-15%.” Still he thinks that the costs of masks (inconvenience, discomfort, and dehumanization) are large enough that they don’t pass a cost-benefit test. But this seems like a very strange conclusion given that he suspects masks reduce contagion by 10-15%! So let’s be explicit about the cost-benefit analysis.
[I am assuming that reducing contagion by 10-15% means 10-15% fewer cases and deaths. I see this as a bare minimum, since contagious disease can follow exponential growth trends, so 10-15% less contagion could mean that cases/deaths are reduced by more than 10-15%, but I’m making a simplifying assumption and the hard case.]
Quantifying the costs of the pandemic deaths is tricky, and it’s something that Bryan and I have debated before. Perhaps this is just a rehash of that debate (Bryan is highly skeptical of the VSL estimates), but I think it’s worthwhile to plug in some numbers.
The U.S. Census Bureau is gradually releasing data gathered in the 2020 decennial. Their release of a map showing which US counties have lost population caused a small Twitter furor.
52% of all counties have smaller populations in 2020 than in 2010.
Metro areas are prominent this decade as the l… twitter.com/i/web/status/1…— U.S. Census Bureau (@uscensusbureau) August 12, 2021
Visually speaking, it’s a lot of brown. People are leaving rural counties in favor of urban areas with jobs and amenities.
The main facts from Home for a Millennial were: 1) although millennials were slower to buy homes, they are trying to buy them now and bidding up housing prices in desirable metros 2) millennials were more likely to live with parents than previous generations, so that’s part of the answer to where they were prior to the home buying scramble 3) the previously-not-house-buying phenomenon is not associated with chronic unemployment
Buying a home in the desirable areas is going to be expensive, unless there has been a lot of building. Texas, the leader in building, added more than 1.5 million housing units in the last decade. The map above illuminates what “moving to Texas” means. At the county level, some people are leaving Texas. However, the booming cities of Texas are really booming.
Being the largest generation, millennials are going to be a factor in the general move from rural to urban areas. I have about two peer friends who, after graduate school, moved to a rural place. They are garden influencers, using hashtags like #AllTheNature. The novelty of growing their own vegetables has earned them a minor celebrity status among my internet circles. How trad of them. The exception proves the rule. Most millennials don’t want to farm or even dabble in raising goats. If I grew up in farm country, my social media experience would be very different, so I don’t want to conclude too much from my bubble. The Census data confirms it. Many young Americans are gathering into the cities and leaving the rural areas.
I have a (white) Boomer relative who has 4 siblings. He was born in Iowa. I remember him telling me that his large family would drive 2 hours to visit another large family, for fun. He said the only thing to do for entertainment was visit each other’s kids. Those 5 siblings “escaped” cold Iowa in favor of the more desirable metro areas, and they did not go on to have large families of their own.
The move to cities and the shortage of housing therein connects with the delay on forming families (relative to past generations). Expensive housing could be delaying desired children, or millennials who don’t want children could be moving to places that are more fun than the farm.
Aside from rural America losing population, the other big result from the Census was the increase in racial diversity, which is also driven by young people.
The Two or More Races population (also referred to as the Multiracial population) has changed considerably since 2010. The Multiracial population was measured at 9 million people in 2010 and is now 33.8 million people in 2020, a 276% increase.
Has anyone offered a simple narrative that relates the increasing racial diversity with the urban land grab?
It’s time to head back to school! Which means it’s time for college students to once again ask the question: How am I going to pay for this?
It’s common knowledge that college is expensive and getting more expensive every year. A Google search for “skyrocketing tuition” produces almost 60,000 results. But whenever a fact is so commonly accepted, it’s worth asking if it’s really true.
Here’s one way to think about: are college tuition and fees increasing faster than the overall rate of inflation? For much of recent history, the answer has been most definitely “yes.” I start the series here in 2006, because there were some methodological changes to the index just before 2006. Cumulatively, college tuition and fees (as measured in the CPI) have increased by 78%, while prices overall have only increased by about 38%.
But for the very recent history, since 2017, the answer is “no.” College tuition and fees have often been increasing at slower rates than overall prices in the CPI, and the difference is especially dramatic in 2021. Since 2017, overall prices have increased by about 12.4%, but college tuition and fees has only increased by 7.8%.
However, even this data overstates how much tuition and fees have gone up for undergraduates in the US!
The latest inflation data for the US has been released, and the headline CPI-U annual increase of 5.4% is once again raising worries that high inflation could be a permanent part of the landscape for the near future.
My personal opinion is that the picture is much too muddled now, between temporary supply issues and low bases for 2020 prices, to say much about the medium-term picture. I think we’ll have a better picture by the end of the year. Still, it’s worth drilling down into the data, as we have done in the past on this blog, to understand some things about economics, prices, and how price changes are impacting real people.
Certainly the prices of some goods are rising at alarming rates. Many of these are related to automobiles and transportation generally, but some categories of food have rose a lot in the past year too (though groceries overall are only up 2.6%).
But I want to talk about two categories of consumption: beer and hot dogs.
Actually, my co-blogger Zachary has already written about beer. And using the producer price index, he found that canned beer is actually cheaper than it was a year ago. If you like canned beer, rejoice! And for all beer at home, the CPI shows only a 1.8% increase since last year, after a similar small 1.6% increase last July (not much of a base effect… a clue for later!).
But not all Americans consumer alcohol. So let’s talk about that most American food product: the hot dog.
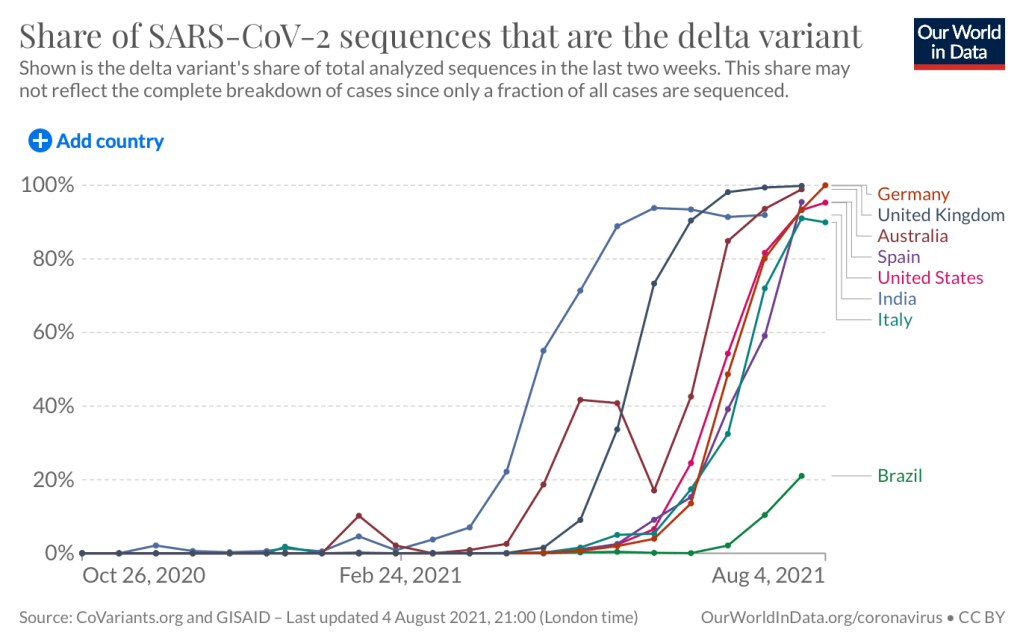
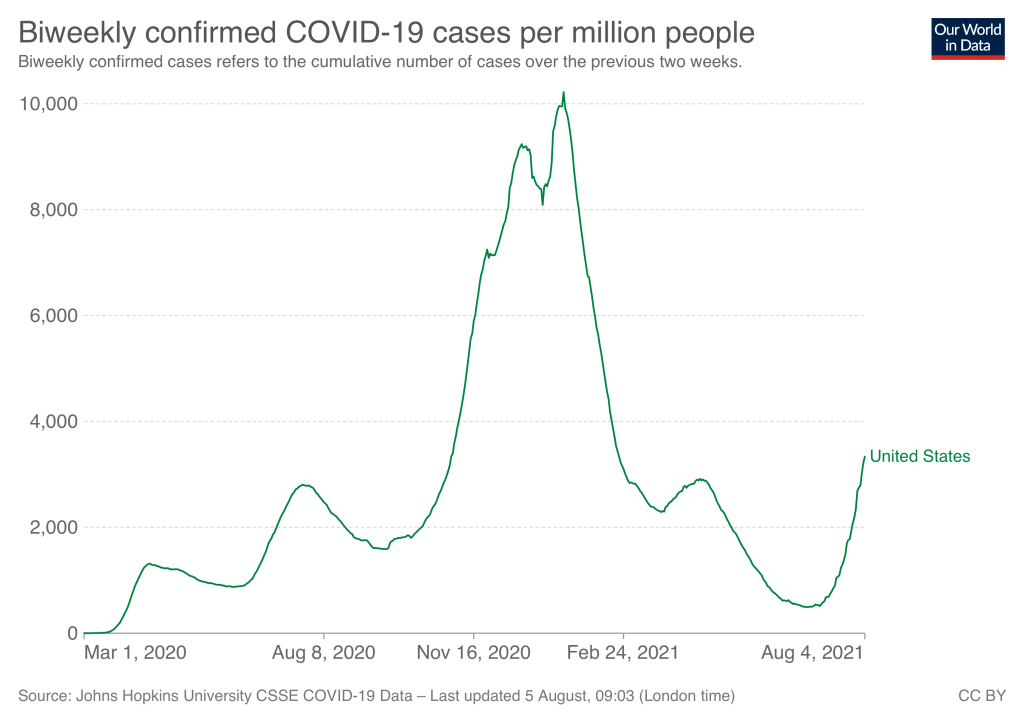
Covid cases are rising rapidly in the US thanks to the more contagious delta variant.
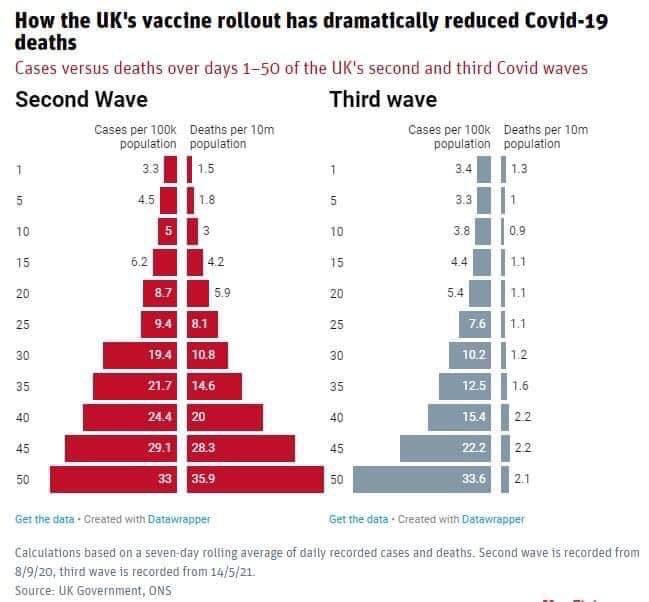
Based on the experience of 2020, this has many states, cities, and organizations considering a return to mask mandates and shutdowns. But our situation in the US has changed substantially since 2020 as we now have better knowledge, better masks, and above all abundant vaccines.
We can see this difference clearly when looking at countries hit by the Delta wave before us. It first devastated India, where less than 10% of the population was fully vaccinated, officially killing 400,000 people and unofficially perhaps 10 times that. In constrast the UK, where more than half the population was fully vaccinated, saw a major spike in cases that did not translate into a major spike in deaths:
The delta waves seem to come and go quickly, with cases rising more rapidly than previous waves, but also falling rapidly 6-8 weeks after they began to rise in India, the UK, and the Netherlands. Cases began rising in the US at the beginning of July, so if this pattern holds we have about 2-4 more weeks of rising cases before a rapid drop.
My worry is that a spike in cases just before the school year will lead schools to shut down just as the danger begins to recede, and when vaccines mean the danger was never as great as in previous waves. Externality-based arguments for shutdowns and mask mandates are now substantially less valid than in 2020 but I don’t know that policymakers have internalized this. The Biden admin actually does seem to get it, calling this a “pandemic of the unvaccinated“- i.e., if you’re worried, get vaccinated, and if other people don’t, that’s their problem. Even with delta the vaccines reduce covid’s danger to you by ~10x, and so also reduce the protection you gain from controlling others by ~10x.
The situation with masks has also changed. Cloth masks have limited effectiveness in protecting you from others, but decent effectiveness in protecting others from you, which meant there was a strong externality-based case for mask mandates. But now in 2021 high-quality KN-95 and even N-95 masks are easily available, and unlike cloth masks they offer excellent protection FROM others, as well as FOR others. Anyone who is vaccinated and wearing an N-95 really has nothing to worry about anymore, and little reason to force masks onto others.
The main externality-based arguments that could still work are for vaccine mandates and for restrictions in areas where hospitals are overwhelmed by unvaccinated Covid patients in a way that substantially worsens care for non-Covid patients. But outside of areas with low vaccination rates leading to overwhelmed hospitals, I no longer see a good case to impose mask requirements or restrictions on movement or events.
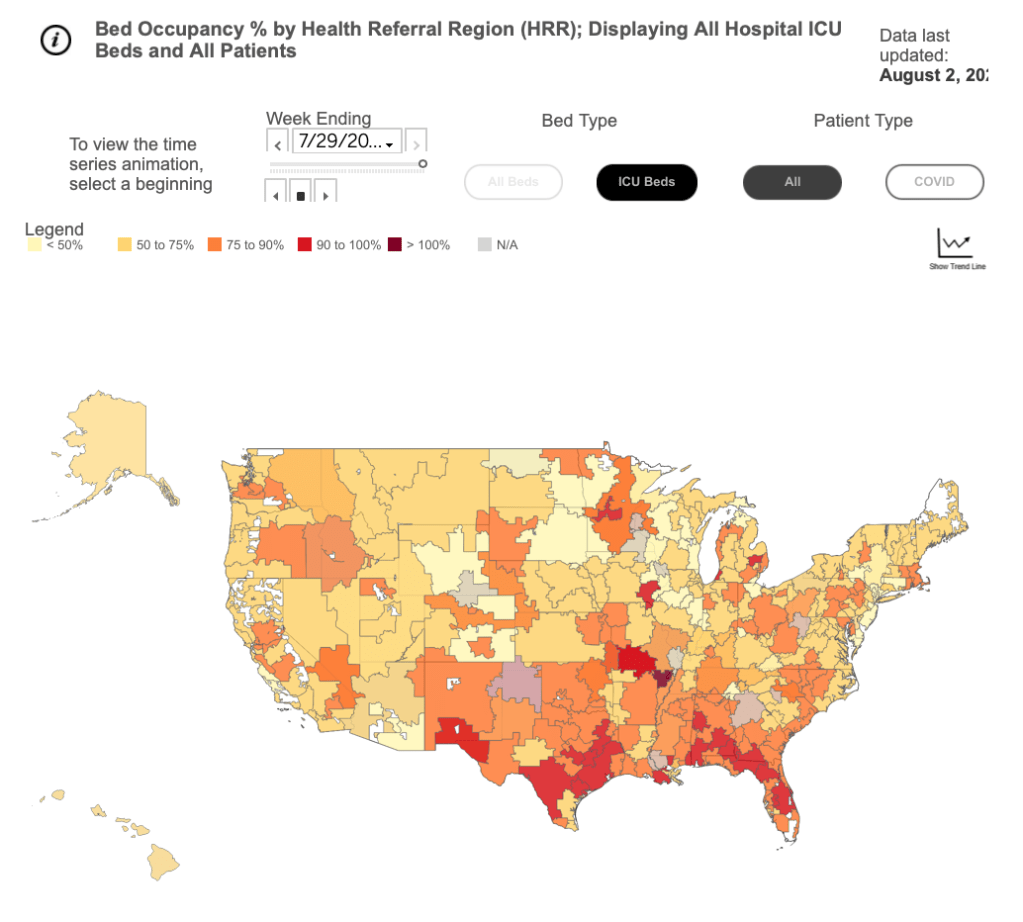
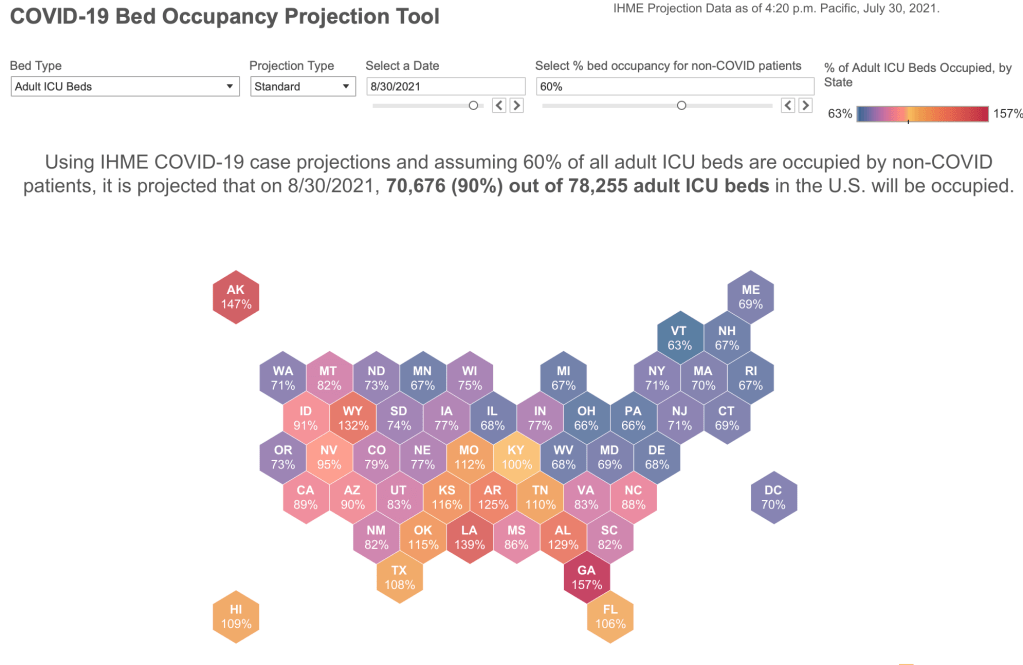
According to one set of projections, by the end of August adult ICUs (though not hospitals overall) will be over capacity in most low-vaccination states:
If you want to wear a mask and avoid crowds, you can, and in fact probably should do at least one of those during the Delta wave of the next month. But the externality-based case for restrictions is mostly gone, and governments would do better to focus on continuing vaccine rollout in the US and ensuring vaccines are available worldwide to help other countries and to prevent more variants from emerging and finding their way here. Personally I’m glad that my employer has a vaccine mandate but, at least currently, no mask mandate. For those who do still want Covid restrictions I ask- what are you waiting for? What event or number would make you say “ok, now we can go back to normal”? When do you expect that to happen? For me, what I was waiting for was vaccines available for everyone and now, at least in the US, we are lucky to have that.
To try and encourage vaccination during the on-going COVID pandemic, there have been many public and private incentives offered. For example, free doughnuts. Or offering $200 to state employees in Arkansas (taxable income, of course!).
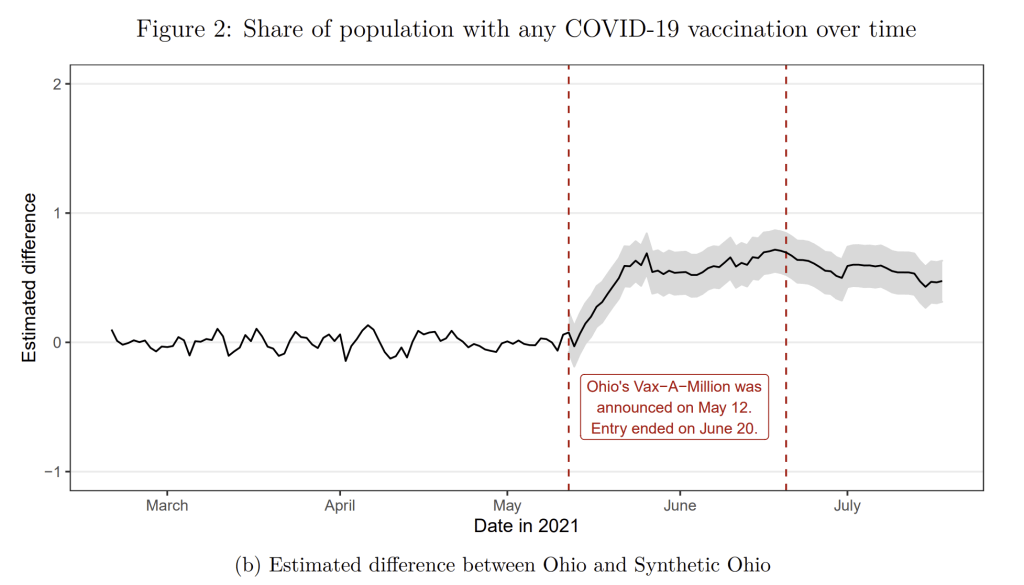
But when the governor of Ohio announced on May 12, 2021 that they would be offering a $1 million lottery prize, with 5 winners, it took the incentive game to a new level (college scholarships were also a prize for 5 winners under 18).
So do the lotteries “work”? Do they get more people vaccinated? And even if they do “work,” does it pass a cost benefit test? Many expressed concern that, even if more people get vaccinated, that this is a lot of money to spend in uncertain budget times.
What do they find? First, vaccine lotteries do work! They estimate that vaccination rates increased by 1.5% in Ohio because of the lottery. This amount is above and beyond the increase that would have been expected without the lottery (by comparing Ohio to other states that didn’t use a lottery — this is what the synthetic control method does).
Lately there has been lots of both good and bad news about the pandemic and its impact on the economy. But here’s once piece of good news you might have missed: the recession which began in February 2020 ended in April. And not April 2021… it ended in April 2020. At least, that’s according to the NBER Business Cycle Dating Committee, which made the announcement last week.
The 2020 recession of just 2 months is by far the shortest on record. NBER maintains a list of recessions with monthly dates going back to 1854 (there are annual business cycles dates before that, including important modern revisions of the original estimates, but the monthly series starts in 1854). In that timeframe, there have been 7 recessions in the 6-8 month range, but nothing this short. Still, it was mostly definitely a recession, as unemployment briefly spiked to levels not seen since the Great Depression. But only for 2 months. Keep in mind that the first part of the Great Depression last 43 months.
Unemployment Rate, 1948-present
But how can this be? Is the recession really over? There are still about 6-7 million fewer people working than before the pandemic began. Lots of businesses are still hurting. The unemployment rate is still 2 full percentage points above pre-pandemic levels. How in the world can we say the recession ended 15 months ago?
To answer that question, it helps to know what NBER and most macroeconomists mean by a “recession” — essentially, it is used interchangeably with “contraction.” It means the economy, by a broad array of measures (NBER uses about 10 measures), is shrinking — or we might say, going in the wrong direction. The only other option, at least in the NBER chronology, is an expansion — when the economy is going in the right direction.
Does an economic expansion mean that everything is fine the economy?
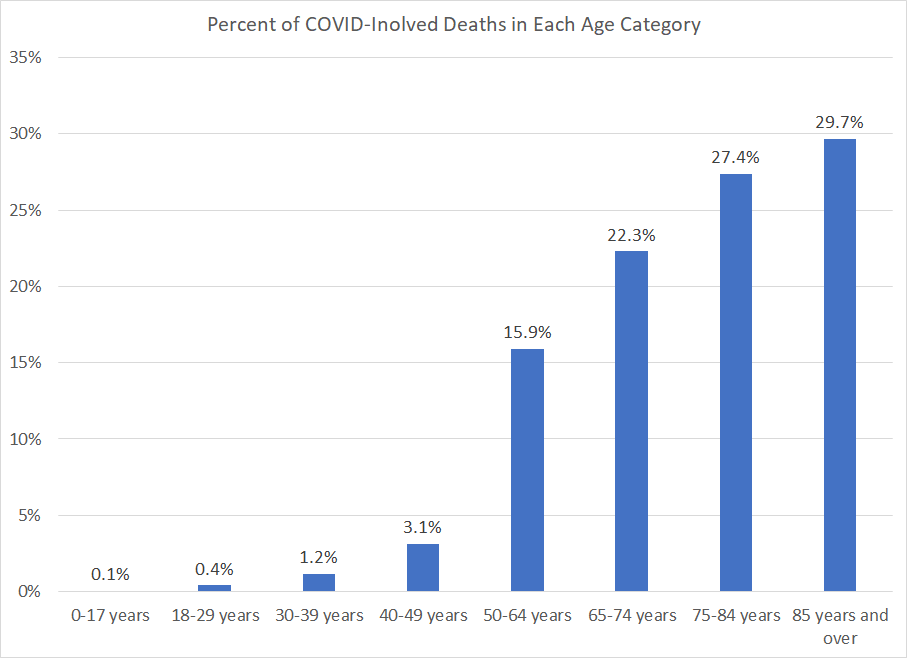
We have known for a long time (basically since the start of the pandemic) that COVID primarily affects the elderly. Infection fatality rates are hard to calculate (since not all infections are reported), but most of the data suggest that the elderly are much more likely to die from COVID than other age groups.
For some, this has become one of the most important aspects of the pandemic. For example, Don Boudreaux emphasizes the age distribution of deaths many times in a recent episode of Econtalk, and he uses this point to argue that we addressed the pandemic incorrectly (to say the least). Boudreaux specifies that COVID is only deadly for those 70 and older. And while I won’t rehash the argument here, please also see my exchange with Bryan Caplan, where he argues that elderly lives are worth a lot less than younger lives (I disagree).
At first blush, the data seems to bear that out. The CDC reports that almost 80% of COVID-involved deaths were among those aged 65 and older (I will use the CDC’s definition of COVID-involved deaths throughout this post). In other words, of the currently reported almost 600,000 COVID deaths in the US, about 475,000 were 65 and older. Throw in the 50-64 age group, and you’ve now got 570,000 of the deaths (95% of the total).
But is this the right way to think about it? Remember, the elderly always account for a large share of deaths, around 75% in recent years. So it shouldn’t surprise us that most deaths from just about any disease are concentrated among the elderly.