Jerome Powell’s term as Fed Chair ends in late May 2026. President Trump has said that he will nominate a new chair and the US senate will confirm them. It may take multiple nominations, but that’s the process. The new chair doesn’t govern monetary and interest rate policy all by their lonesome, however. They have to get most of the FOMC on board in order to make interest rate decisions. We all know that the president wants lower interest rates and there is uncertainty about the political independence of the next chair. What will actually happen once Jerome is out and his replacement is in?
The treasury markets can give us a hint. The yields on government debt tend to follow the federal funds rate closely (see below). So, we can use some simple logic to forecast the currently expected rates during the new Fed Chair’s first several months.

Here’s the logic. As of October 16, the yield on the 6-month treasury was 3.79% and the yield on the 1-year treasury was 3.54%. If the market expectations are accurate, then holding the 1-year treasury to maturity should yield the same as the 6-month treasury purchased today and then another one purchased six months from now. The below diagram and equation provide the intuition and math.
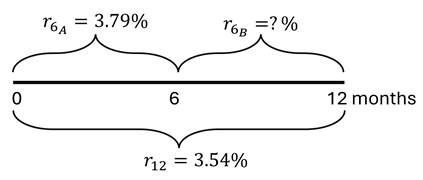
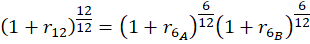
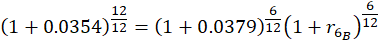

Since the federal funds rate and US treasury yields closely track one another, we can deduce that the interest rates are expected to fall after 6 months. Specifically, rates will fall by the difference in the 6-month rates, or about 49.9 basis points (0.499%). This cut is an expected value of course. Given that the cut is between a half and a zero percent, we can back out the market expectation of for a 0.5% vs 0.0% cut where α is the probability of the half-point cut.* Formally:
Continue reading