Currently, we have software that can write software. What about physical machines that can produce physical machines? Indeed, what about machines that can produce other machines without human direction?
First of all, machines-building machines (MBM) still require resources: energy, transportation, time, and other inputs. A well-programmed machine that self-replicates quickly can grow in number exponentially. But where would the machines get the resources that enable self-replication? They’d have to purchase them (or conquer the world sci-fi style). Where would a machine get the resources to make purchases of necessary inputs? The same place that everyone else gets them.
A the moment, the collapse of Silicon Valley Bank is the dominant story in the news cycle. It seemed like a big deal to me at first, then less of a big deal, then of enormous consequence again. At the moment, my estimation has settled into “A negative event that will hurt some people but will only be of long run consequence unless it yields sufficiently bad new economic policy out of it i.e. receive a bailed that entirely shields them from consequences. But honestly I don’t know. My estimation really shouldn’t move your priors too much unless you were previously sitting at one of the extremes of “Nothing actually happened” or “This is the beginning of a new Great Depression”. I’m quite confident neither of those is correct. If you want a solid accounting, read Noah Smith’s post. I think he probably nailed it.
So here’s a research idea so quarter-baked I haven’t even looked on google scholar to see if it’s been done, let alone would work. What is the relationship between a slow news cycle and pessimistic affect in event coverage? Here’s I’d go about it:
Create an idex of news story variation. Variation in news coverage is an indicator that nothing is happening. When important things happen, they get covered alot, which means there is less variation in stories across outlets.
Run an natural language algorithm for measuring “pessimistic affect” i.e. doomerism in news stories.
Estimate the relationship between lagged news story variation and current pessimistic affect.
?
Publish
The hypothesis is simple: when the news cycle is slow, outlets and pundits have an incentive to not just hype the importance of any event, but accentuate it’s potential negative consequences going forward so they can keep talking about it.
That’s it. Thats the idea. I hope you will include me in the acknowledgments when accepting your various research awards and accolades.
I say what economists are supposed to say. I tell everyone who will listen that they should invest in index funds and then don’t check their balances. I explain that abnormal returns stem from abnormal information. Individuals are unlikely to have abnormal insight about publicly traded companies because other people have more time and resources to find that information. Further, even if a professional has abnormal insight, it’s not likely to persist over time. Index funds get around the problem of idiosyncratic risk and the brevity of abnormal insight by riding on the back of the more informed. I say all of this and I believe it in my heart.
I teach macroeconomics and I’ve published about asset volatility. I know more about inflation and the macroeconomy than the typical investor. From mid-2020 through now the S&P500 has gained 11.3% annually. My personal return has been 21% annually. It’s true, however, that the first half of 2022 was rough. But I can’t help but feel happy and confident.*
Rather than channel my inner, but very real, grumpy old economist, I want to instead reassure you that, yes, the NYT article “Is the entire economy gentrifying?” is as bad, if not worse than you think. I have a duty to link to it, but I’d actually prefer you not click through.
It’s bad in the all the ways that can make you feel crazy and gaslit.
The title is a question even though the entire article is an assertion
The subtitle uses colloquial language to signal condescension and superiority
It makes grievous economic errors that betray the authors broad ignorance of the subject
There’s little doubt that part of why it so blatantaly telegraphs that it’s bad is for the very purpose of pulling in an additional audience of hate-readers. I could grump about the addition of that unnecessary question mark in the title to mitigate any culpability for the meandering anecdote driven assertions that follow. I could whine that describing profits as “fat”, rather than “large”, “growing” or, god forbid, without an adjective at all, let’s us know right away that their story has a villain that you can blame while feeling superior to all the fools who don’t realize they’re being taken advantage of.
I could definitely settle into a cathartic, apoplectic rage at the omission of the G*D D**M MONEY SUPPLY as a potential input into inflation. For such an economic sin they should have to take the train to Paul Krugman’s CUNY office and silently wait in contrition until he shows up to absolve them (pro tip: bring snacks).
I could do any of those things. You probably could, too.
But you shouldn’t. These are professional journalists, but amateur economists, filling column inches in the New York Times. Your sibling might have a marginally worse opinion on the economy tomorrow, but let’s be honest: their opinions were already pretty bad. Just enjoy your week.
There’s a new paper about the minimum wage and its effects on crime. I wrote a paper (with Amanda Agan) about the minimum wage and crime (here’s a slightly older ungated version). I have received several requests to comment on the new paper because, based on the abstracts, our papers appear to generate conflicting results. Spoiler alert: they don’t. Sorry to disappoint those who came looking for an academic blood bath.
I am happy to talk about the new paper, by Fone, Sabia, and Cesur (FSC), but let’s get the big part out of the way. Our paper on the minimum wage looks at criminal recidivism, defined as a return to prison, for those who have been released from prison. These are people whose conviction resulted in them being in incarcerated in a prison (not jail) who, on average, served nearly 2 years and were subsequently released at age 35. The FSC paper uses arrest data. Their principal observation regards property crime arrests committed by 16-24 year olds.
Our two papers identify fundamentally different results about fundamentally different populations that, in my opinion, hinge on completely different mechanisms.
Our paper is old news, so I won’t belabor the point. Succinctly, we found that minimum wage increase of $0.50 reduced the probability an individual returns to prison within 3 years by 2.15%. The availability of state EITCs also reduced recidivism, but only for women.
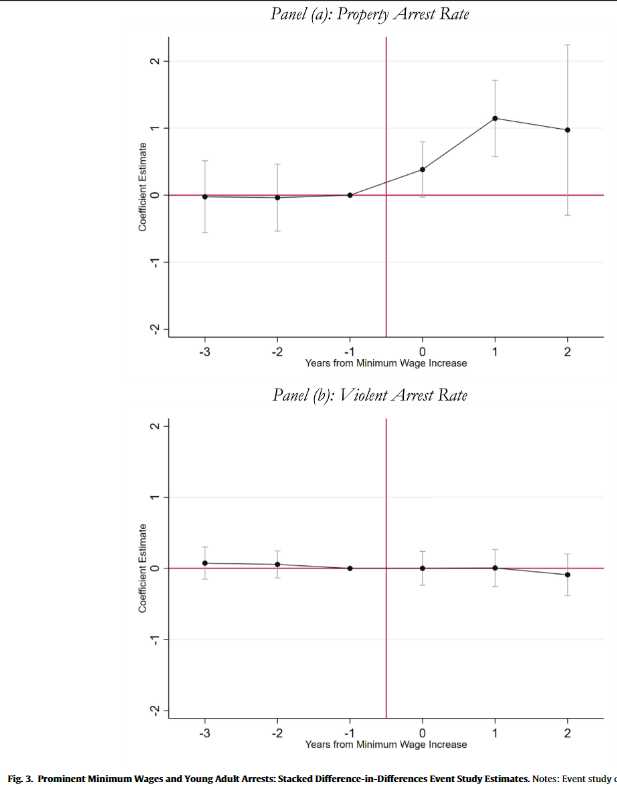
The FSC paper use’s Uniform Crime Report data to look at arrests. Here’s the figures and tables that I’ll focus on for our discussion:
FSC find that property crime arrests increase for 16-24 year olds in an event study estimate, where an increase in the minimum wage of at least $1 serves as an “event”:
Property crime arrests in their diff-in-diff estimate reaffirm this estimate. They also, however, observe negative effects on property crime arrests on 35-49 year olds, though the coefficient is too noisy to be statistically significant. These results are similar to ours, though because we were looking at individual recidivism we had the benefit of estimating over ~6 million observations (vs the 45 thousand county-years of FSC).
When FSC dig into the crime categories further, there is no effect on burglary, robbery, or auto theft. The property crime effect is entirely in larceny. Let’s also note the positive effect of the minimum wage on vandalism.
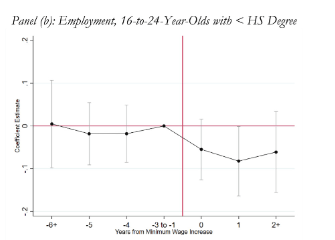
Here’s an important tidbit: UCR data does not distinguish between misdemeanor petty (petit) larceny and felony larceny. One last result: employment is noisily declining for 16-24 year-olds who have not yet completed high school.
Let’s add it all up: when a state increases the minimum wage by at least $1, we observe an increase in larceny and vandalism arrests of 16-24 year-olds, without any effect on robbery, burglary, auto theft, or violent crime, all while reducing the employment of 16-24 olds who have not yet completed high school. Can you see where I’m going with this?
Shoplifting. When states significantly increase the minimum wage, employers stop hiring teenagers. Those teenagers, laden with time but bereft of spending money, rediscover the allure of the five-finger discount. That is my interpretation of these results and nothing about these results seems strange to me or at odds with the earlier findings in our paper on the minimum wage and recidivism.
I don’t think the authors have really done anything wrong here. I could manufacture some of the usual gripes if I really wanted too, but the identification strategy seems at least broadly sound and the data is widely used. The estimated magnitudes seem plausible. If I was going to complain about anything, it would probably be the imputed $766 million dollar price tag placed on the externality, but I’m also not well-versed in the costs of shoplifting (and in case you’re reading something into my tone, I do not think shoplifting can be dismissed as unimportant). If I had to hang my hat on something, though, I’d say that’s probably on the hefty side. In footnote 48 they consider a a more conservative estimate of a $128 million dollar externality. That seems more plausible to me.
The minimum wage literature is one we all, every single one of us, bring our own political and economic baggage to. When our paper found that the minimum wage reduced criminal recidivism, a lot of people latched on to it because what they heard was “minimum wages stop crime”. I’m sure a lot of people will latch on to FSC’s new paper because they want to hear “minimum wages cause crime”. The reality, of course, is vastly more nuanced. We should expect these laws to have heterogeneous effects born of complex interactions, particularly when we stratify populations into those interacting with an institution as rife with peculiarities and pathologies as the US criminal justice system.
I think the single most under-considered development in labor economics has been the revolution in the real-time measurement of labor output over last decade (although there was an interesting article recently in AEJ: Applied looking at the shift in the late 70s from standardized to variable wages within firms). A lot of ink has been spilled agonizing over why “no one wants to work” in fast food establishments for $15-$20 an hour, without appreciation for how much those jobs have been transformed by operations monitoring and management. Simply put, there’s no hiding on the line anymore. You’re either producing or you’re not and everyoone knows. Now, whether subpar performance will quickly result in termination is unclear in such a tight labor market, but you can be sure that your inadequate productivity will be quantified and communicated to you. These numbers may create a feeling of shame or inadequacy, perhaps even sufficient to make you work harder, increasing the disutility of labor faster than your earnings increase. Your prospects for advancement or a pay increase will correlate directly with your measured productivity. The spread of such indignities, previously reserved for those working assembly lines, sales, or independent contract work, are not limited to fast food:
“Workers at the plant told Bloomberg News that Tesla monitors keystrokes to track how long employees spend per task and how much of the day they spend actively working.“
There have long been lines of work where work could be paid “piecemeal” i.e. paid per unit output. These jobs were typically limited to those where labor’s output was discrete, easily measured, and where quality could be distilled into sufficient/not sufficient categorization. Great for sewing textiles, bad for writing code or making gourmet food. When you’re working a piecemeal job you can be rewarded for high output, but it’s a double-edged sword. There’s no obscuring your contributions within the uncertainty of productivity or the efforts of others. It’s the difference between singing in a 50 person choir or playing golf. No one listening to that choir will ever know I can’t hit a note, even after dozens of performances. My fraudulence on a golf course is transparent after a single swing.
The revolution in labor measurement has all kinds of ramifications for the nature of work, management-labor relations, and the distribution of income.
1) Being watched is stressful, being measured doubly so.
2) Nobody likes being judged. Always being watched will only heighten labor skepticism and antagonism towards management.
3) Bigger rewards for higher producers can only increase income inequality even if wages rise for everyone
Better measurement could increase labor’s share of their marginal revenue product simply by reducing uncertainty and risk. This increased share, combined with greater productivity, could raise incomes for all laborers. Even under these assumptions, however, greater measurement is can still increase income inequality because it will likely reward the most productive workers more than the least.
It’s hard to usefully speculate on the exact mechanisms through which transitioning to piecemeal work affects labor. Perhaps it’s safer to just be grossly reductionist: increased monitoring and measurement of labor threaten’s every worker’s god-given right to do a half-assed job.
Worker’s, like all of us, are under-appreciated in the guile and sophistication they bring to bear when maximizing their utility. It’s not just where and when we work, it’s how we work. Some want to climb the ladder, some don’t. Some work to live, some live to work. Some jobs sustain us while we participate in high risk-reward labor tournaments in our side-hustles (music, art, indie game design, etc).
Doing a half-assed job is a tried and true strategy to living a great life if you have the tremendous fortune of living in a wealthy country. Employing half-assed workers, however, is a bit trickier and I suspect the rise in monitoring and measurement is a market response that reveals that the conflict between half-assed labor and management has never solved.
How will such conflicts be reconciled? My suspicion is that this will eventually come out as a mutually beneficial gain, on average, for all parties. Workers will be monitored and measured more tightly, which will make work less pleasant, but they will be paid more and work less. I suspect many of us would actually prefer to work 40% harder for half the hours and make double the pay. There will be people who lose in the transition, however. Every workplace has a slacker who floats from job to job, doing far less than the bare minimum, riding the wave of uncertainty that keeps their unemployment at least temporarily intact. For many occupations that strategy will cease to be viable. I’d feel bad for them…but I don’t. Maybe that makes me a grumpy old man, but if if anyone was taking bets I’d put a lot of money down that for the last 50 years it’s been mostly white men riding off the labor of others…and it’s been mostly the over-contribution of women to marginal output that has subsidized their quarter-assed counterparts.
The days of management trying to increase productivity by exhorting motivational platitudes while dangling the carrot of advancement while pretending to know who deserves credit are over. We know who’s doing the work. Which means that even if you are still formally receiving a salary, your salary will so tightly hew to your productivity that it will effectively be a piece rate. That also means, by the way, that management has no excuses anymore, either. You know who’s getting the work done. The same forces undermining a half-assed labor strategy will hopefully continue to undermine casual cronyism and discrimination as well.
But don’t worry, humans are clever. We’ll game each new system along the way. You’ll never find a more whole-assed effort than someone trying to figure out how to half-ass their job.
SMET was the first acronym used by the National Science Foundation to stand for “science, technology, engineering, and mathematics”. There was a re-branding of the name that we owe to the American biologist Judith Ramaley. The STEM acronym sounds much better!
Does a cosmetic change matter? Will more students study STEM than SMET? The US government funds initiatives aimed at encouraging students to study STEM fields, so answering this question is important.
Some of these initiatives date back several decades, such as the National Science Foundation’s (NSF) Advanced Technological Education program, which was started in 1992 to provide funding for two-year colleges to develop programs that promote STEM education and prepare students for technical careers. The National Math and Science Initiative (NMSI) was established in 2007 and offers training and support for teachers to improve STEM instruction in K-12 schools. In 2009, the White House launched the “Educate to Innovate” campaign, which aimed to improve STEM education in American schools and increase the number of students pursuing STEM careers. Additionally, several federal agencies, including NASA and the Department of Energy, have launched initiatives over the years to promote STEM education and provide opportunities for students to engage in STEM-related research and projects. These efforts reflect a recognition of the importance of STEM fields to the country’s future economic competitiveness and national security, and a commitment to ensuring that all students have access to the skills and knowledge needed to succeed in these fields.
There is something to be said for branding and marketing in relation to science education. However, I see this as an open question: How much does branding matter, as opposed to the fundamentals of the pay and quality of available jobs that students can get in STEM fields?
I’m preparing a public lecture on my “Willingness to Be Paid” paper. Using an experiment, I examined what factors affect a student’s decision to do a computer programming job. I tried out an encouraging message which turned out to not work in the sense that it did not increase participation. I’m planning to open my talk with the SMET affair as an example of what is being tried with messaging and the tech labor supply.
When I was younger, and a more disagreeable libertarian, I was staunchly against almost all taxes. And not just all taxes in general. Each type of tax was a specific affront to human dignity in its own egregious way.
Sales taxes represented government meddling in private contracts.
Income taxes represented government stealing people’s time.
Property tax represented that living on land was a privilege provided by the state landlord. Private property was a myth.
I won’t win the fight over whether the state governments should be spending money. But, given that we have to pay for services, I can definitely opine on the desirable and undesirable traits of one tax or another. Economists tend to like sales taxes because they encourage saving, investment, capital formation, and greater output. Maybe that’s a good idea. But it’s not clear to me that we should incentivize consumption tomorrow at the cost of consumption today. There is no singular right answer to that tradeoff.
I would love to have a per-adult lump sum tax in which everyone pays the same dollar figure no matter what. I would also love to receive a million dollars – and that ain’t going to happen either. In lieu of a lump sum tax on people, I think that the next best thing is a lump sum tax on land. Each acre in a county can pay the same tax bill. On the margin, firms would economize on land and tend toward density. That would bring lots of agglomeration and economies of scale. Jeremy wrote recently about land taxes, which have a lot of proponents. I share the concerns about estimating land value and I think that it’s a non-trivial challenge.
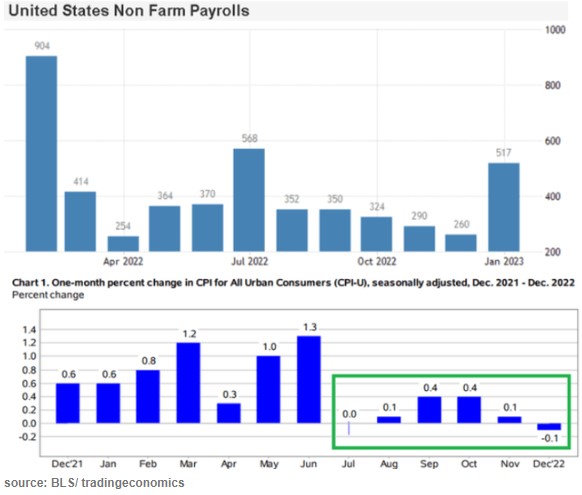
The stock market drools and rips higher at the slightest sign that inflation is abating, since that portends rate cuts instead of rate hikes by the Fed, and a return to the golden days of easy money. But what do the latest data show? Here I’ll show several charts to show what we know so far.
The last couple months’ data points in the lower chart show that inflation (as estimated by CPI) has essentially leveled out and may be starting to decline a little. That is fine but it still leaves inflation far above the Fed’s 2% target. Victor defines a Fed “pivot” not as actually cutting rates, but simply a halt to raising them. By that somewhat anemic definition, sure, a Fed pivot could well come in the next few months. But that leaves rates still very high by recent standards. The real question is when will inflation come down low enough to justify significant rate cuts. The Fed screwed up so abysmally last year with its ridiculous “this inflation is only transitory supply chain issues” that they really cannot afford to relent too soon, and let inflationary psychology take hold.
Side comment: the big “blowout” jobs number for January (last bar on the right, on the top chart above) caused a huge buzz. But there are strong reasons to discount it as an artifact of “ revisions, adjustments, control factors, and recoding “, per Jeffrey Snider.
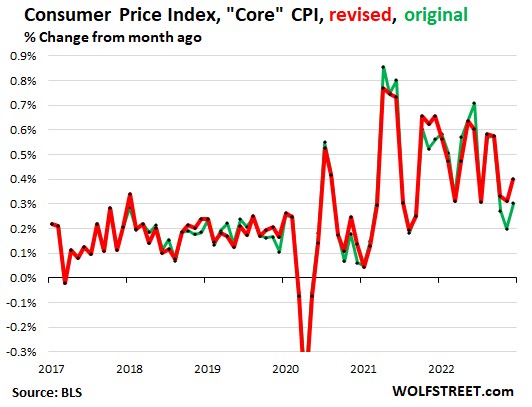
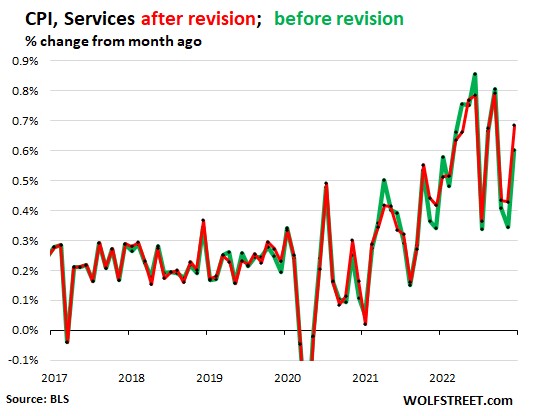
On the other side of the bull/bear divide, Wolf Richter published a glass-half-empty article noting how the Bureau of Labor Statistics recently revised its CPI numbers, and the changes shifted the numbers so as to undermine the argument that inflation has started to drop rapidly:
The chart above with revisions (red line) shows core CPI barely declining over the past 9 months or so, and no trend for an acceleration in that decline. The chart below shows CPI for Services (where we consumers spend most of our money, and which is closely correlated to wages) is holding nearly steady around a red-hot 0.55%/month or about 6.6% annualized. It could be longer than the market thinks before there are substantial rate cuts.
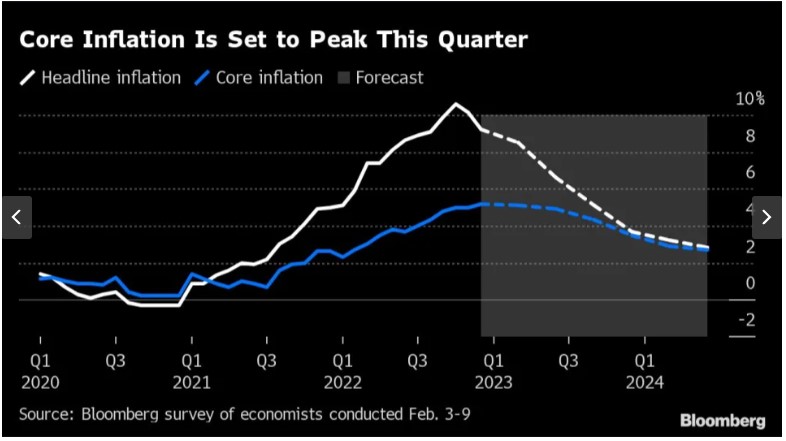
And from the Eurozone, there is this chart, courtesy of Bloomberg via Yahoo, depicting the results of polling economists as to the future course of inflation there:
The consensus view is that inflation in Europe will not approach the 2% target until well into 2024. The European Central Bank is expected to hike by 0.5% in March, followed by another 0.25% to reach 3.25%. (This is much lower than the Fed’s interest rates, but that is probably because the U.S. is still working off the orgy of COVID-related payments that dumped trillions in peoples’ pockets here in 2020-2021). Cuts by the ECB are not expected until the second quarter of 2024.
THIS JUST IN: The January CPI data just came out today (2/14), and pretty much matches up with the picture presented above. Inflation is falling, but ever so slowly, and so it becomes more likely that the Fed will keep its rates higher for longer:
“The Consumer Price Index (CPI) for January showed a 0.5% increase in prices over the past month, an acceleration from the prior reading, government data showed Tuesday. On an annual basis, CPI rose 6.4%, continuing a steady march down from a 9.1% peak last June. Economists had expected prices to climb 6.2% over the year and jump 0.5% month-over-month, per consensus estimates from Bloomberg. …
Core CPI, which strips out the volatile food and energy components of the report, climbed 5.6% year-over-year, more than expected, and 0.4% over the prior month. Forecasts called for a 5.5% annual increase and 0.4% monthly rise in the core CPI reading.”
(For another recent take on the inflation picture, see James Bailey’s The Murky Macro Picture, on this blog).
I like Patrick Maholmes and, all else equal, prefer the Kansas City fan base if for no other reason than they seem less interested in settting things on fire.
But alas, the Eagles are probably going to win because the value of quarterback play became so dominant that the incentives to innovate and invest in alternative strategies has finally resulted in an equilibrium where the opposing team is dominant in every other area of play. Which is a long-winded way of saying that annoying old people who rail on about line play, running the ball, and defense, who have been consistently wrong about everything for 20 years, finally get to have their moment in the sun and say “I told you so” and you, smart person who values your mental health, will simply smile and nod and not take the bait to argue with them further.
Or maybe Maholmes’s ankle is back to 70% and they win? Who knows? We’re talking about a sport that, 19 games deep, is almost entirely determined by the two interacting random probability generators: injuries and general luck.
Enjoy the excuse to socialize and eat junk food, which for many of us is 90% of the utility proposition in watching the game.