A new working paper by Mike Makowsky and Patrick Warren finds that “firearms offered an effective means of Black self-defense in the Jim Crow South.” By this the authors mean that greater access to firearms by Blacks decreased the likelihood of being lynched.
That headline finding is sure to be provocative in both debates over gun control and the history of Jim Crow. And with good reason. What I found most interesting is how they measured Black access to firearms. Since they did not have direct access to any good sources measuring Black access to firearms, they proxy access with the percent of Black suicides committed with firearms. Increased access to firearms would also mean a higher proportion of suicides were committed using firearms.
We assess firearm access in the U.S. South by measuring the fraction of suicides committed with firearms. Black residents of the Jim Crow South were disarmed, before re-arming themselves during the Civil-Rights Era. We find that lynchings decrease with greater Black firearm access. During the Civil-Rights Movement, both the relative Black homicide and Black “accidental death by firearm” rates decrease with Black firearm access, indicating frequent misclassification of homicides as accidents. In the contemporary era, greater firearm access correlates with higher Black death rates. We find that firearms offered an effective means of Black self-defense in the Jim Crow South.
A balance sheet gives a snapshot of a corporation’s assets and liabilities. The difference between total assets and total liabilities is (by definition) the value of the equity owned by the owners or shareholders of the company.
With, say, a manufacturing firm, the assets would include tangible items such as buildings and equipment and inventory, and intangibles such as cash, bank accounts, and accounts receivable. Liabilities may include mortgages and other loans, and accounts payable such as taxes, wages, pensions, and bills for purchased goods.
The balance sheet for a bank is different. The “Assets” are mainly loans that the bank has made, plus some securities (such as US Treasury bonds) that the bank has purchased. These assets pay interest to the bank. The money the bank used to make these loans and purchase these securities came mainly from customer deposits or other borrowings by the bank (which are considered “Liabilities” of the bank), and also from paid-in capital from the bank owners/shareholders. [1] As usual, the current equity of the bank is assets minus liabilities. Thus:
The Federal Reserve System is a complex beast. We will not delve into all the components and moving parts, but just take a look at the overall balance sheet.
Unlike other banks, the Fed has the magical power of being able to create money out of thin air. Technically, what the Fed can do with that money is mainly make loans, i.e. buy interest-bearing securities such as government bonds. The Fed makes its transactions through affiliated banks, so it credits a bank’s reserve account with a million dollars, if it buys from that bank a million dollars’ worth of bonds. Those bonds then become part of the Fed’s “assets”, while the reserve account of the bank at the Fed (which is a liability of the Fed) becomes larger by a million dollars. Since the Fed is not a for-profit bank, the “Equity” entry on its balance sheet is nearly zero. Thus, total assets are essentially equal to total liabilities.
The Fed also has the power of literally printing money, in the form of Federal Reserve Notes (printed dollar bills). These, too, are classified as liabilities. Thus, you are probably carrying in your wallet right now some of the liabilities of the central bank of the United States.
Before 2008, the balance sheet of the Fed was under a trillion dollars. Nearly all the “Liabilities” were the Federal Reserve Notes and nearly all the “Assets” were US Treasury securities. The reserve accounts of the affiliated Depository Institutions was minuscule. All that changed with the Global Financial Crisis of 2008-2009. To help stabilize the financial system, the Fed started buying lots of various types of securities, including mortgage-backed securities (MBS) [2]. The Fed thus propped up the value of these securities, and injected cash (liquidity) into the system.
Here is a plot of how the assets of the Fed ballooned in the wake of the GFC, from about $ 0.9 trillion to over $ 4 trillion:
The initial purchases in 2008 were US Treasuries, which the Fed had prior authorization to do. To buy other securities, especially the mortgage products, required congressional authorization. The increased liabilities of the Fed which offset these purchases were mainly in the form of larger reserve accounts of the affiliated banks. The Fed started paying interest on these reserve accounts, to keep short term interest rates above zero at all times (otherwise the whole money market in the U.S. might implode).
With the Fed relentlessly buying the mortgage and bond products, the interest rates on long-term mortgages and bonds was kept low. This was deemed good for economic growth. The Fed tried to sell off some securities to taper down its balance sheet in 2018, but that effort blew up in its face – – the stock market started crashing in response in late 2018, and so the Fed backtracked . You can look at weekly tables of the Fed balance sheet here.
Anyway, the GFC and its aftermath provided the precedent for massive purchases of “stuff” by the Fed. When the Covid shutdown of the economy hit in March of this year, the Fed very quickly went into high gear. Its balance sheet shot up from $4 trillion to $7 trillion in just a few months. It bought not only Treasuries and MBS, but corporate bonds. This was way outside the Fed’s original charter, but the crisis was so intense that nobody seemed to care whether these actions were legal or not. And now, to finance the huge deficit spending of the federal government in the wake of the shutdowns, the Fed has been buying up nearly the entire issuance of Treasury bonds and notes.
These actions may have long term consequences we will explore in later posts [3]. For now, the Fed has made it clear that it will keep interests rates near zero for at least the next couple of years. Invest accordingly.
ENDNOTES
[1] Huge caveat: This statement gives the impression that a bank must first receive say a thousand dollar deposit before it can make a thousand dollar loan. That is not the case. The reality is just the opposite: the act of making a thousand dollar loan actually CREATES a corresponding thousand dollar deposit. This is very counterintuitive, and I won’t try to explain or justify this point here.
[2] Technically, the Fed is not “buying” the mortgage-backed security (MBS). Rather, it is making a “loan” to the bank, and holding the MBS as collateral against that loan.
[3] It is now harder to take the federal deficit seriously as a constraint on spending: the government can issue unlimited bonds to fund deficits, which the Fed will purchase to keep interest rates low. Yes, the government has to pay interest on those bonds, but the Fed has to return most of that interest to the Treasury, so the real cost to the government of that extra debt is low.
If you liked Star Wars: A New Hope, and everyone does, then you will enjoy The Queen’s Gambit. It’s like The Mighty Ducks for chess, with a lot more drugs and female coming-of-age.
The main character, Beth, achieves success and seems happy at the end. There is some pretty on-the-nose dialogue about happiness in the show.
Other female characters represent other arenas of achievement. A high school friend, Margaret, has a baby. The baby curtailed Margaret’s freedom and locally-high-status social life. Marriage and children is portrayed as a drag. Margaret’s baby carriage basket contains only clinking bottles of alcohol, which I suppose is meant to indicate that Margaret is even more miserable than the face she presents to Beth when they meet in a store.
Motherhood is not interesting to Cleo, a model. However, even her own achievements in terms of physical beauty leave Cleo unsatisfied. Cleo says, “Modeling and models are insipid.” Cleo’s life might seem exciting to those of us on the outside of the fashion world, but Cleo wishes she could win at chess and is openly envious of Beth.
A non-Beth female character who is pursuing a life of the mind is Jolene. Jolene is a paralegal who aspires to be a lawyer because she believes that will make her powerful and respected. Jolene envies Beth’s winner status. Jolene has an active role in giving Beth straight talk about drugs and also in loaning Beth money.
Patriotism and religion are despised by Beth and Jolene. They hate the Christians who run an orphanage where Beth and Jolene apparently received an excellent education. Jolene says she was happy when the director of the “Home for Girls” broke her hip and became crippled thereafter.
The irony of the Queen’s Gambit is that the show exalts intellectual ability and yet a social scientist is left with very little to think about. The star of the show is mesmerizingly beautiful. Viewers mostly just stare at her. Here is some honesty from Twitter
In the show, every typical source of meaning is knocked over like a king in checkmate. It all works out for Beth, because of her inimitable talent and adoring fans.
If you are actually thinking, you might wonder what those of us who are not chess champions should do with ourselves. We can’t all become lawyers, and not even all lawyers are happy.
Some research shows that American women report wishing they had more children.
In the show, Beth is just as beautiful and fashionable as Cleo, but also wins at chess. Some of us mortals can’t have it all. If anyone is wondering, this is the haircut of the woman who might be the most comparable historical female to Beth.
Georgian chess player Nona Gaprindashvili, women's world chess champion, 1st woman titled FIDE grandmaster, here playing against 28 men at once in Dorset, UK, in 1965. pic.twitter.com/ZRryqCmOrN
Incidentally, a social science book has recently been written about the economic power wielded by the Cleo’s. You can listen to Ashley Mears on status and beauty here.
If you aren’t from the Southeast, you might not know that Chattanooga is a fun city. I recommend it as a place to spend a day, with or without kids. The aquarium and Lookout Mountain attractions are fun.
The riverfront downtown area is booming (in a low height building restriction kind of way). Developers are building fancy new townhomes near the Walnut Street pedestrian bridge. The middle of the bridge offers lovely views of the river and mountains.
I noticed a sign saying that residents had “fought” to save the bridge from being demolished. Sometimes, it seems like a bad idea for residents to fight to save a historic structure. Insisting that a house built in 1890 must remain as it looked in 1890 can stifle the growth of a city. This instance seems different to me. The story of this beautiful bridge is an example of having a vision, clever city planning, and providing public goods through a mix of private and government funds.
The bridge was closed to motor vehicles in 1978. It’s not hard to imagine why a bridge built before automobiles could become unsafe for modern traffic by 1980.
The Tennessee Department of Transportation recommended demolishing the bridge, but Chattanooga’s then-Mayor Pat Rose suggested another idea: use it for pedestrians only. Rose and Ron Littlefield, AICP, the city’s Public Works Commissioner, kept the idea alive by hiring local architects … to develop a study for restoring the bridge.
Under the auspices of the not-for-profit organization Chattanooga Venture, a committee was formed to determine whether the bridge could and should be restored. Once it was determined a rehabilitated bridge could support pedestrian traffic, the local community rallied behind saving the bridge. Helping transfer the $2.5 million in federal funds originally designated for demolition to rehabilitation were former Chattanooga Mayor Gene Roberts, former U.S. Representative Marilyn Lloyd and former Sen. Al Gore. Local fundraising efforts secured the additional $2 million needed to restore the bridge.
The ice cream and coffee shop at the beginning of the bridge has a menu in English, Spanish, French, Chinese, and Russian. That’s pretty cosmopolitan for the American South. The lovely historic bridge really draws a crowd.
On Thanksgiving, we cook a bird. We eat meat. Then I make turkey soup by boiling the carcass and such. After making turkey soup, I have nagging thoughts, ‘That seemed quite economical. I have so much food now. I should make soup from scratch again soon.’
In fact, I will not make soup from scratch again until next Thanksgiving.*
Part of the reason for starting this blog is to explore my own cognitive dissonance. Is making soup from scratch economical and should I be doing it more? Right now I’m trying to work full-time and also produce food for a family 2 or 3 times every day. I want to minimize the time I spend cooking.
To start, naturally, I Googled “is soup the most economical food”.
Peasants and poor folk could get nutrients out of bones and root vegetables by making soup. Soup is economical in that sense, but I’m not talking about making broth.**
The Seattle Times has an article about chicken soup from scratch. In their introduction, they gave themselves away:
During America’s inexorable march toward processed food, chicken soup became something to buy, not something to make … and many cooks simply don’t know how satisfying a project it is.
So, they are admitting that it’s a lot of work. I do not want a “satisfying project”. I want food that is healthy and appealing; and I also want to avoid buying food from restaurants constantly.
Another article I arrived at was by Prudent Penny Pincher. The title is “60 CHEAP AND EASY FALL SOUPS”. Never trust all-caps. According to this site:
Name brand soups are about $2 per serving. Many soups can be made at home for under $1 per serving with less 30 minutes of prep/cook time.
The Prudent Penny Pincher page is little more than a list of links to other recipe sites. They wash their hands of the responsibility of telling you how to actually make soup. For research, I clicked their link for chicken soup.
What do you need to have on hand to make chicken soup in a mere 30 minute? Canned broth, for one. Making your own broth is not ‘quick and easy.’ You also need to have cooked chopped chicken and chopped vegetables.
If I have cooked chopped chicken and chopped vegetables, then I could just eat that! That’s a meal nearly finished. My guilt over not making soup from scratch regularly was completely resolved when I read that.
I had a similar revelation after I tried juicing for a week. Not counting the cost of a juicing machine, should you be juicing? If you have never once felt a pang of guilt for not juicing, then maybe you are male.
I borrowed a juicer once and I bought lots of fresh produce. I chopped fruits and veggies into chunks and juiced them. One cup of juice came out, which I drank while spending 20 minutes cleaning the yucky machine covered in pulp.
I realized that I should stop at the step where I have chopped fruits and veggies and just eat them. Fortunately, I hadn’t bought the juicer. Pity the women who juice regularly because of sunk cost bias after they bought the machine. Anyway, I concluded that juicing was expensive in terms of ingredients and time.
Through writing this, I realized that I make soup from scratch at Thanksgiving because it’s a holiday and I’m on vacation. It’s fun when you have free time.
Anyone who disagrees is welcome to comment. Am I discounting the future too much? Should I put work into making soup so that we can eat soup for days?
*There is an exception. I make delicious scallop corn chowder once a year when I am on vacation with extended family in the summer. So, that’s also when I’m not doing my professional work and an extended family member is taking care of my children.
**I do not participate in trendy “bone broth”. Do you think my son would be happy if I put bone broth on the table for dinner?
We wish you all a happy Thanksgiving day. I wondered if the academic literature could provide any insights to use on this day. If Google is a good guide, the formal economics literature has ignored the phenomenon of the Thanksgiving tradition.
“We Gather Together” from the Journal of Consumer Research in 1991 does, at the very least, exist. The first line of the abstract made me smile.
Thanksgiving Day is a collective ritual that celebrates material abundance enacted through feasting.
The third line of the abstract made me think.
So certain is material plenty for most U.S. citizens that this annual celebration is taken for granted by participants.
How do we conduct cost-benefit analysis when different policies might harm some in order to help others? This question has become increasingly important in the Year of COVID.
In particular, it is possible that some interventions to prevent the spread of COVID may save the lives of the vulnerable elderly, but have the unfortunate effect of causing other harms and potentially deaths. For example, increased social isolation could lead to increased suicides among the young (we don’t quite have good data on this yet, but it’s at least a possibility).
If you don’t think any public policies will reduce COVID deaths, then the post isn’t for you. It’s all cost, no benefit!
But for those that do recognize the trade-offs, a common way to do the cost-benefit analysis is to look at “years of life lost” or YLL. This is a common approach on Twitter and blogs, but I’ve seen it in academic papers too. In this approach, you look at the age of those that died from COVID, and use an actuarial life table to see how long they would have been expected to live. For example, an 80-year-old male is expected to live about 8 more years. Conversely, a 20-year-old males is expected to live another 56 years.
So, here’s the crude (and possibly morbid) YLL calculus: if a policy saves six 80-year-olds, but causes the death of one 20-year-old, it’s a bad policy. Too much YLL! (Net loss of 8 years of life.) However, if the policy saves eight elderly and kills just one young person, it’s a good policy. A net gain8 years of life. (Of course, we can never know these numbers with precision, but that’s the basic idea.)
But I think this approach is fundamentally flawed. Not because I oppose such a calculation (though maybe you do, especially if you are not an economist!), but because it’s using the wrong numbers. Briefly: we shouldn’t value every year of life equally.
The superior approach for this calculation is to use an approach called the “value of a statistical life” (VSL). In this approach, we assign a value to human life (the non-economists are really cringing now) based on revealed preferences of various sorts. Timothy Taylor has a nice blog post summarizing how this value can be estimated, which is much better than how I would explain it.
In short, the average VSL in the US is around $10-12 million, depending on how you calculate it. You might be skeptical of this figure (I was at first too!), but what really convinced me is that you get roughly this number when you do the calculation using very different approaches. It just keeps coming up.
So how does VSL apply to our COVID calculation? What’s really interesting about VSL is that it varies with age. And not perhaps as you might expect, as a constantly declining number. It’s actually an inverted-U shape, with the highest values in the middle of the age distribution. Young and old lives are roughly equally valued! Once we realize this, I think we can see how the YLL approach to analyzing COVID trade-offs is flawed.
Kip Viscusi has been the pioneer in establishing the VSL calculation. If you’ve heard that “a life is worth about $10 million” and scratched your head, Viscusi is the man to blame. Over the weekend, Viscusi gave his Presidential Address to the Southern Economic Association (he actually delivered it in-person at the conference in New Orleans, but to a very small crowd since the conference was over 90% virtual).
As you might have guessed given his area of research, Viscusi used this address to estimate the costs of COVID, both mortality and morbidity (the talk is partially based on this paper). He didn’t talk much about the policy trade-offs, but we can use his framework to talk about them. Here’s a very relevant slide from the presentation.
Notice here we see the inverted-U shaped VSL curve. You may not be able to read it very well, but Viscusi helps us with a bullet point: VSL at age 62 is greater than at age 20. Joseph Aldy, a frequent co-author of Viscusi, has extended the curve even further up to age 100 which you can see in this column. Aldy and Smyth use a slightly different approach, but the short version is that the VSL for a 62-year-old is much greater than a 20-year-old (roughly double). The 20-year-old VSL is roughly equal to that of an 80-year-old.
So let’s go back to the above YLL calculation, which told us that if a policy intervention only saves six 80-year-olds but results in the death of one 20-year-old, it’s bad policy. Too many YLL!
However, using the VSL calculation, this policy is actually good, since 20- and 80-year-olds have roughly equally valued lives. The policy only becomes bad if it kills more 20-year-olds than elderly folks. This may seem strange, given the short life left for the 80-year-old, but it is where the VSL calculus leads us.
I will admit, this calculations are morbid in some sense. But we live in morbid times. Death is all around us, and we need to some clear method for assessing trade-offs. YLL seems like the wrong approach to me. VSL seems better, but if we take a third approach, something like All Lives Matter (and matter equally), we end up with the same calculation when comparing a 20- and 80-year-old.
In the end, we should also be looking for policy interventions that have low costs and don’t result in additional deaths. For example, I think there is now good evidence that wearing masks slows the spread of viruses, which will lower deaths without any major costs. But if we are going to talk about trade-offs, let’s do it right.
(Final technical note: there is an approach that combines YLL and VSL, called “value of a statistical life year” [VSLY]. Viscusi discusses VSLY in the paper that I linked to above. I won’t get into the technicalities here, but suffice it to say VSLY involves more than simply adding up the years of life lost.)
How often do we hear about “data heroes”? As a data analytics teacher, this just thrills me. Bloomberg reported on the Data Heroes of Covid this week.
One of the terrible things about Covid-19 from the perspective of March 2020 was how little we knew. The disease could kill people. We knew the 34-year-old whistleblower doctor in China had died of it. We knew the disease had caused significant disruption in China and Italy. There were so many horror scenarios that seemed possible and so little data with which to make rational decisions.
The United States has government agencies tasked with collecting and sharing data on diseases. The CDC did not make a strong showing here (would they argue they need more funding?). I don’t know if “fortunately” is the right word here, but fortunately private citizens rose to the task.
The Covid Tracking Project gathers and releases data on what is actually happening with Covid and health outcomes. They clearly present the known facts and update everything as fast as possible. The scientific community and even the government relies on this data source.
Healthcare workers have correctly been saluted as heroes throughout the pandemic. The data heroes volunteering their time deserve credit, too. Lastly, I’d like to give credit to Tyler Cowen for working so hard to sift through research and deliver relevant data to the public.
This weekend I am participating (virtually, remotely) in the Southern Economics Association annual meeting where economists talk about research in progress. I saw Laura Razzolini present a new project yesterday.
She and coauthors surveyed people in the city of Birmingham, AL before and after a major disruption to commuter traffic. One thing they find is that people who have a longer commute due to a road closure are more stressed.
AS IT HAPPENED, Covid came along and started stressing people soon after. So they did another round of surveys and have great baseline data to compare Covid-stressed people with. I will not discuss her results on how stress affects decision making here. She has got some really neat results. The paper will be called something like “Uncovering the Effects of Covid-19 on Stress, Well-Being, and Economic Decision-Making”.
The magnitude of the increase in stress from a longer commute was something like 2.5 on a scale of 1-10. (Do not quote me – I do not have her paper to reference – this is from memory)
A comment from the audience was that it looked like the magnitude of the increase of stress from a longer commute and from Covid were similar. How could that be? Isn’t a deadly disease worse than traffic?
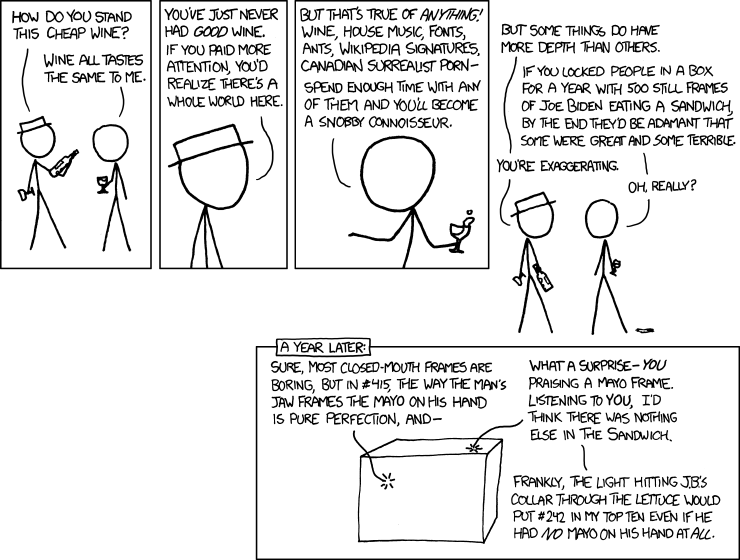
To explain this, I return to my favorite xkcd comic. When you hover your mouse over the comic, it says “Our brains have just one scale, and we resize our experiences to fit.” (Apropos of nothing, the fact that the comic artist picked Joe Biden as an example of someone who isn’t very important in 2011 seems pretty strange now.)
So, when traffic got worse people could only express “my life got worse”. And when Covid-19 caused shutdowns in the Spring of 2020, people again said “my life got worse”.
We only have one scale, and we resize our experience to fit. Thanksgiving is coming up. I would hope that we could take a day off from the 2020 year-of-doom talk and find something to be grateful for, because things actually can get worse. I also send out sincere condolences to all those who will be spending The Holidays apart from loved ones because of Covid-19.
My local Facebook community group is a treasure trove of unfiltered NIMBY and YIMBY sentiments. I’m creating a “nimby” tag for blogs I write about them.
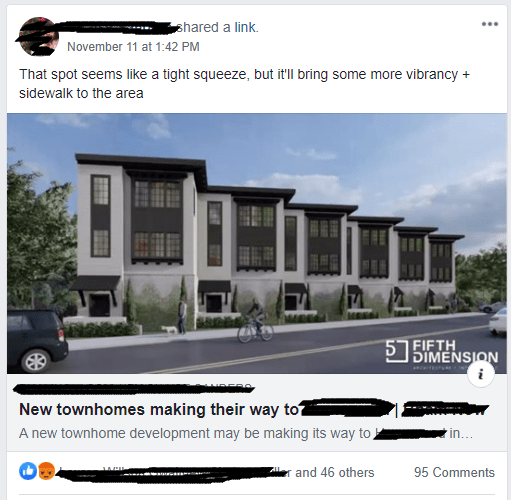
This FB post went up last week about some proposed townhouses that would be built on what is currently an ugly empty paved area of land on the side of a highway.
There were 40 “likes” and only 5 angry face reactions. Given some of the vitriol I have seen against building previously, I was surprised at how many people reacted positively. This can’t be treated as a scientific poll, but the fact that so many people bothered to say they approve was interesting to me.
Most of the land in our city is zoned for single-family detached houses, meaning most of it looks more like what people call suburbs.
Here’s what people said in the comments:
“I like the look. I also like Chaise’s term ‘vibrancy’.”
“ I wish they weren’t going to be so tall.” (Note that they are not tall. Most of this town used to be one-story 1-bathroom ranch houses, and there is a lot of nostalgia for those tiny houses.)
“Why are we junking up our downtown with condos.” (That one got 8 likes, and someone replied “because they sell.” Isn’t it astounding that someone would call this “junking”?)
“Almost Anything built in that location is a step in the right direction.” (8 likes)
Some people complained that this is not adding “affordable housing” to our city because these units are expensive. I might post more explicit debates over affordable housing in the future.
Apparently, currently, there isn’t much opposition to developing an empty lot on the side of the highway with a few expensive units. There has been a WAR for the past year after a proposal to increase the density of housing closer to downtown. Anti-development types are angry that the city council is not doing more to block new building.
The prospective developer for this empty weed lot needs approval from the city council. Our city elections last month became rather contentious. It was, in part, a struggle between people who want to preserve curbs and doors just as they were in 1970 versus newer younger residents who are more pro-development.