We’re harder on the ones that are listening

“We hurt the ones we love because we can” is a cliche, though perhaps I should be attributing it to a specific writer. Its truth is something that I find extends beyond our close familial, platonic, and romantic relationships. The mechanism behind misdirected aggression is simple: we are exposed to a source of stress that we are unable to affect, and the innocent bystanders most proximate to us become collateral damage specifically because we can affect them. The anger inside us needs to go somewhere and, in a parable of true irony, your mutual affection becomes the channel through which you express anger and frustration that has nothing to do with them.

There are a lot economists, writers, pundits, public intellectuals whose work I consume. Often I agree, sometimes I don’t, but I keep reading them because I consistently learn from them. Lately I’ve found myself becoming more frustrated with a greater share of their writing, often because they’re not being hard enough on the Trump administration, attempts to dismantle core insitutions, or the indiscriminate cruelty behind the rampant incompetence. I want them to be meaner and angrier and more direct. I want them to have an affect that I can’t. To be clear, I’ve attributed more power and influence to them than they actually have, but I think that’s not the real problem.

The real problem is that I know that no one in the Trump administration cares that they are cruel or incompetent. You can, at best, embarrass these people briefly, but you can’t shame them. They only internalize consequences and they’ve yet to experience any. They have coalesced around the singular belief that has served as the North Star for Trump’s entire life: there are no rules. Rules are fake. An illusion. A mass delusion. There are no rules and you can do whatever you want in the moment that serves your ambitions and ego and then move on to the next thing.

What do you do when your entire mechanism for affecting and contributing to world is the written word, criticism, the speaking of evidence-based truth to power and that power doesn’t care? What I find myself tempted to do, and what a lot commentators our there (especially on bluesky) are doing, is attacking the people who might and do actually listen with an undeserved fury. The criticism is often valid, but it’s just 30% meaner than it needs to be. More personal. More cruel.

I care about AI. I care about energy subsidies. I care about crime and education and health. But, if I’m being honest, there are times every day when I don’t. I’m a professor, I care about and contribute to bleeding edge research, but the moment we are living through isn’t about PhD level questions. These are 5th grade social studies times. Democracy. Rule of law. Citizenship. All men are created equal. Basic human dignity. That’s the reality and it’s not hyperbole.

I hope everyone will keep doing their research and commentary about the nitty gritty of day to day science. I also hope that everyone will take the time to grant just a bit more space emphasizing the basics, to leave no doubt about where they stand. Becaue no matter how someone might identify politically, in this moment it’s mostly irrelevant. Liberal, conservative, libertarian, classical liberal, neoliberal, new liberal, social democrat. The differences are trivialities. There are only two groups that matter: those who want to keep the basic institutions intact and those that want to burn it to ground. That’s it.

So just keep that in mind when you’re mad about someone online, about what they wrote, what you think they believe. Are they trying to hold the world together while bandits are stripping the walls for copper and carving out chunks of marble from every load-bearing pillar? If the answer is yes then they deserve grace. I’m trying and I hope you’ll do the same for me.

Tariff Tilly (Satire)

Satire news shows are, in my opinion, one of the higher forms of art that my country has produced (and an example of our exports). “Meet Tariff Tilly, the perfect replacement for the 37 dolls your kid does not need” from The Daily Show

“Tariff Tilly” builds. There is even a comment on interest rates (addressed in my previous post).

In this house, we believe in economists writing about dolls. You can find more at https://economistwritingeveryday.com/?s=barbie or https://economistwritingeveryday.com/?s=dolls

Manufacturing Jobs of the Past

This post is co-written with John Olis, History major at Ave Maria University.

There is a popular myth that manufacturing jobs of the past provided a leg-up to young people. The myth goes like this. Manufacturing jobs had low barriers to entry so anyone could join. Once there, the job paid well and provided opportunities for fostering skills and a path toward long-term economic success. There is more to the myth, but let’s stop there for the moment. Is the myth true?

One of my students, John Olis, did a case study on Connecticut in 1920-1930 using cross sectional IPUMS data of white working age individuals to evaluate the ‘Manufacturing Myth’. We are not talking causal inference here, but the weight of the evidence is non-zero. The story above has some predictions if not outright theoretical assertions.

  1. Manufacturing jobs paid better than non-manufacturing jobs for people with less human capital.
  2. Manufacturing jobs yielded faster income growth than non-manufacturing jobs.
  3. Implicitly, manufacturing jobs provided faster income growth for people with less human capital.

Using only one state and two decades of data obviously makes the analysis highly specific. Expanding the breadth or the timescale could confirm or falsify the results. But historical Connecticut is a particularly useful population because 1) it had a large manufacturing sector, 2) existed prior to the post WWII boom in manufacturing that resulted from the destruction of European capacity, and 3) had large identifiable populations with different levels of human capital.

Who had less human capital on average? There are two groups who are easy to identify: 1) immigrants and 2) illiterate people. Immigrants at the time often couldn’t speak English with native proficiency or lacked the social norms that eased commercial transactions in their new country (on average, not always). Illiterate people couldn’t read or write. Therefore, having a comparative advantage in manual labor, we’d expect these two groups to be well served by manufacturing employment vs the alternative.

Being cross-sectional, the individuals are not linked over time, so we can’t say what happened to particular people. But we can say how people differed by their time and characteristics. Interaction variables help to drill-down to the relevant comparisons. There are two specifications for explaining income*, one that interacts manufacturing employment with immigrant status and one that interacts the status of illiteracy. The baseline case is a 1920 non-operative native or literate person. Let’s start with the below snapshot of 1920. The term used in the data is ‘operative’ rather than ‘manufacturer’, referring to people who operate machines of one sort or another. So, it’s often the same as manufacturing, but can also be manufacturing-adjacent. The below charts illustrate the effect of lower human capital in pink and the additional subpopulation impacts of manufacturing in blue.

In the left-hand specification, native operatives made 2.2% less than the baseline population. That is, being an operative was slightly harmful to individual earnings. Being an immigrant lowered earnings a substantial 16.8%, but being an operative recovered most of the gap so that immigrant operatives made only 6.1pp less than the baseline population and only 3.9pp less than native operatives. In the right-hand specification, unsurprisingly, being illiterate was terrible for one’s earnings to the tune of 23.4pp. And while being an operative resulted in a 1.2% earnings boost among natives, being an operative entirely eliminated the harm that illiteracy imposed on earnings.

Both graphs show that manufacturing had tiny effects for a typical native or literate individual. But manufacturing mattered hugely for people who had less human capital. So, prediction 1) above is borne out by the data: Manufacturing is great for people with less-than-average human capital.

But what about earnings *growth*? See below.

Continue reading →

The Most Regulated States

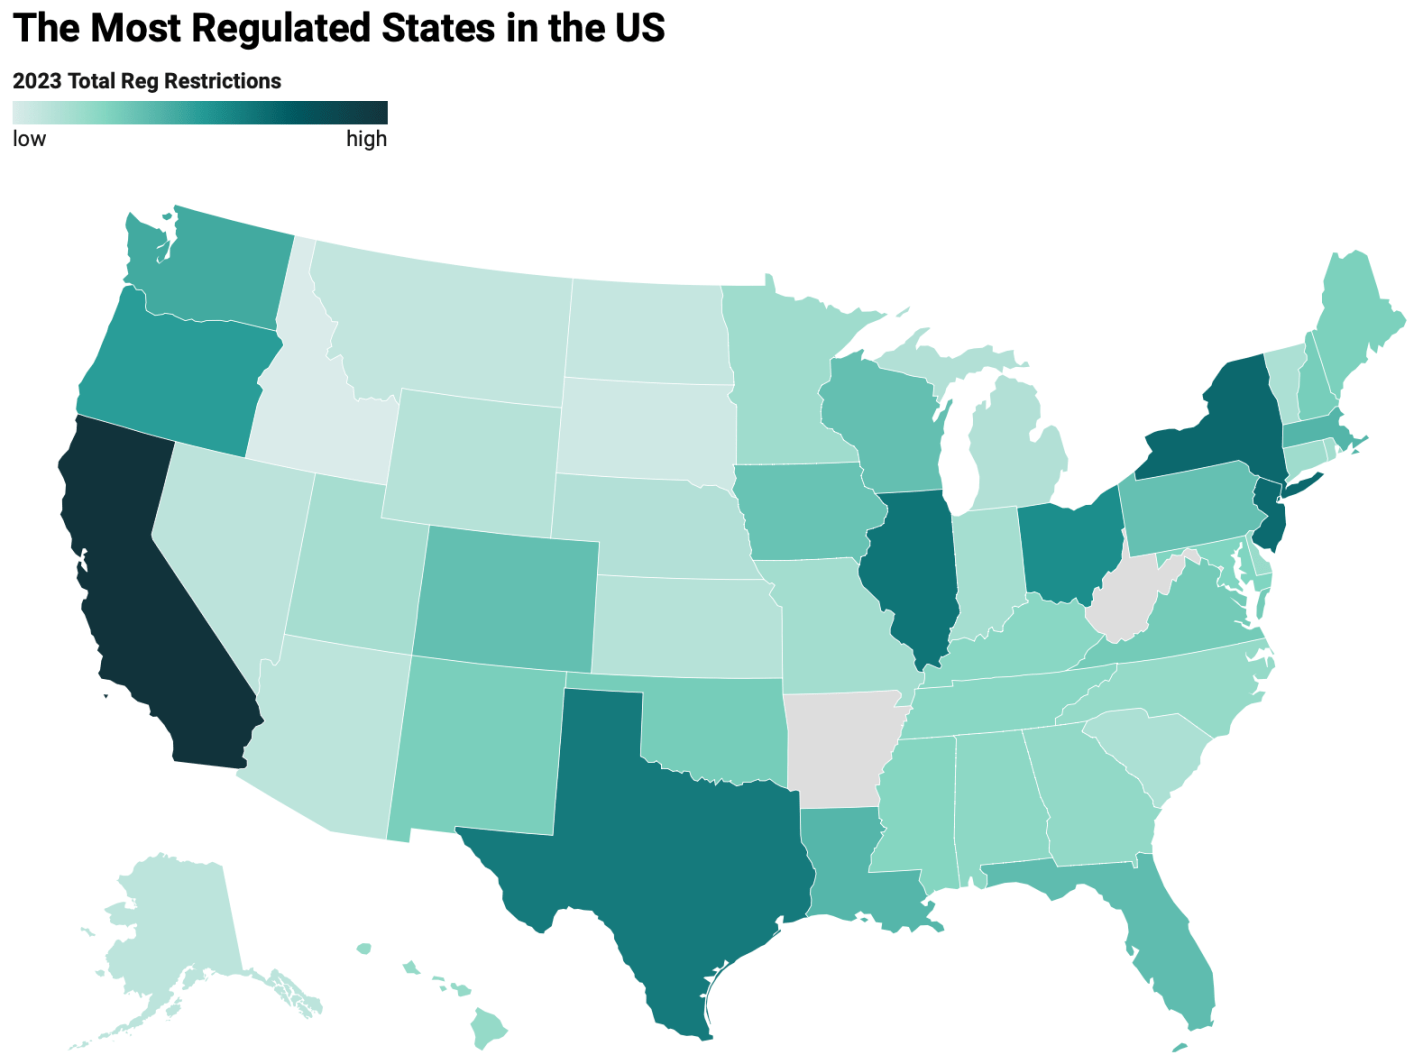
The Mercatus Center has put together a page of “Snapshots of State Regulation” using data from their State RegData project. Their latest data suggests that population is still a big predictor of state-level regulation, on top of the red/blue dynamics people expect:

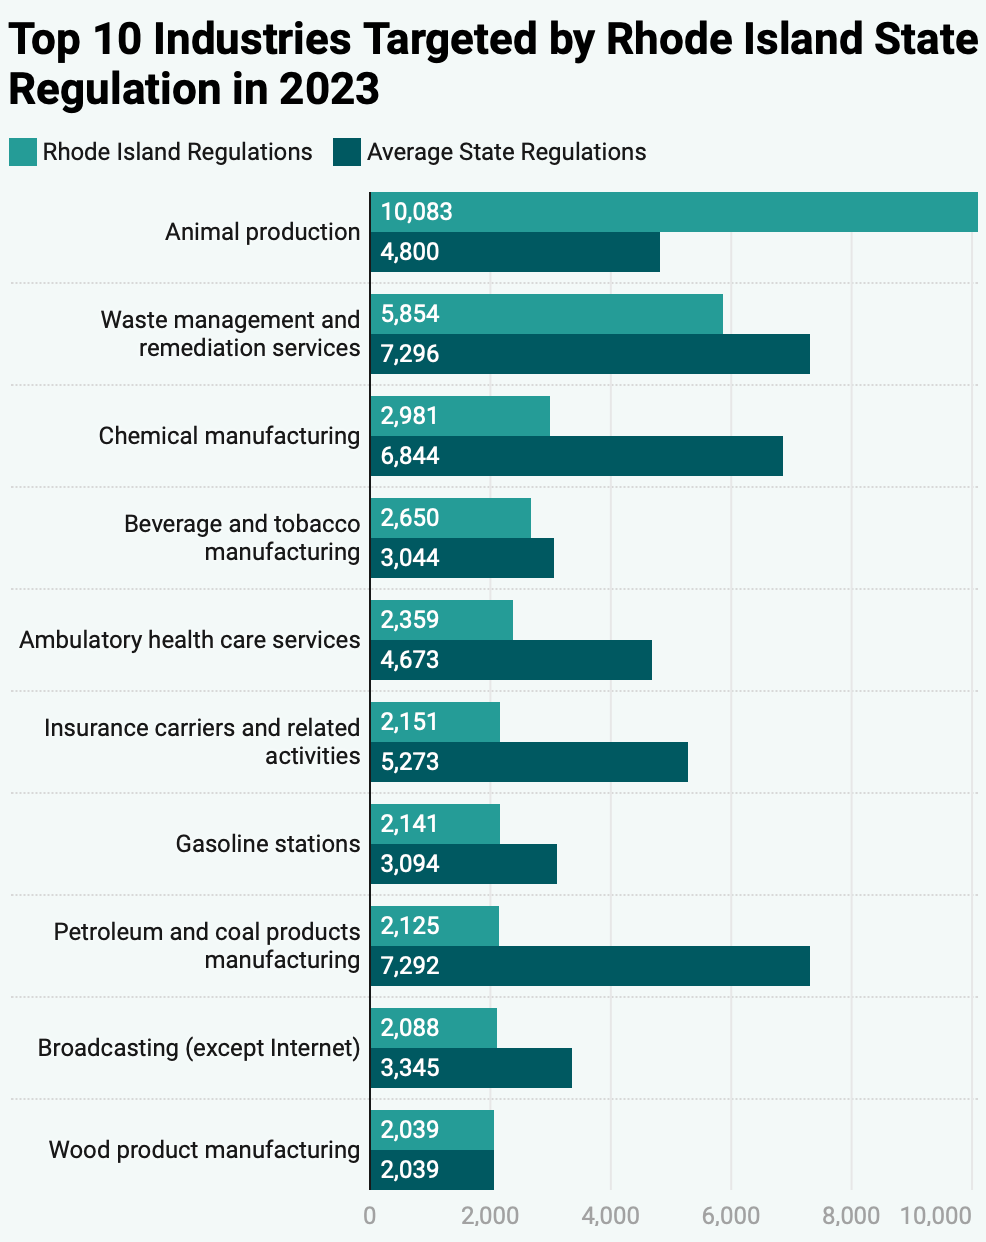
They also made pages with much more detail on each state, like what the most regulated industries in each state are and how each one compares to the national average:

You can find your state here.

Spending on Necessities Has Declined Dramatically in the United States

Has it gotten easier or harder for Americans to afford the basic necessities of life? Part of the answer to this question depends on how you define “basic necessities,” but using the common triad of food, clothing, and housing seems like a reasonable definition since these composed over 80% of household spending in 1901 in the United States.

If we use that definition of necessities, here is what the progress has looked like in the US since 1901:

The data comes from various surveys that the Bureau Labor Statistics has collected over the years, collectively known as the Consumer Expenditure Surveys. The surveys were conducted about once every 1-2 decades from 1901 up until the 1980s, and then annually starting in 1984. Some of these are multi-year averages, but to simplify the chart I’ll just state one year (e.g., “1919” is for 1918 and 1919). The categories are fairly comprehensive: “food” includes both groceries and spending at restaurants; “housing” includes either mortgage or rent, plus things like utilities and maintenance; and “clothing” includes not only the cost of the clothes themselves, but services associated with them such as repairs or alterations (much more important in the past).

We can see in the chart that over time the share spent on these three areas of spending has declined dramatically, taken as a group. Housing is different, but it has been fairly stable over time, mostly staying between 22% and 29% of income (the Great Depression being an exception). There are two time periods when these costs rose: the Great Depression and the late 1970s/early 1980s. Both are widely recognized as bad economic times, but they are aberrations. The jump from 1973 to 1985 in spending on necessities was fully offset by 2003, and today spending on necessities is well below 1973 — even though for housing, it is a few percentage points greater.

A chart like this shows great progress over time, but it will inevitably raise many questions. Let me try to answer a few of them in advance.

Continue reading →

Learnings From Trading Short Volatility Funds, 2. Use Leveraged Stock Funds Instead

In last week’s post, I described how short volatility funds work. They are short (as opposed to long) near-term VIX futures. This means that when a market panic hits and VIX (as measure of volatility) spikes, the prices of these short vol funds plunge, along with stock prices. But as optimism returns to the markets, prices of short vol funds start to recover, as do stocks.

Thus, both short vol funds and general stock funds are reasonable ways to play a market panic. If (!!!) you manage to call the bottom and buy there, you can hold for maybe a couple of weeks until prices recover, and then sell at a profit.  I tried to do just that with the market meltdown last month in the wake of the president’s tariff ultimatums: I bought some short vol funds (SVXY, which is a moderate -0.5X VIX fund, and the more aggressive -1X fund SVIX), and also some leveraged stock funds. I discussed leveraged funds here.

I chose to buy into SSO, a 2X leveraged S&P 500 stock fund, whose daily price moves up (or down) by twice the percentage as does the S&P. Obviously, if you think stocks will go up say 10% in the next month, you will make more money by buying a fund that will go up 20% instead, which is why I bought a 2X fund rather than a plain vanilla (1X) stock fund. A related fund, which I did not buy this time, is UPRO, which is a 3X stock fund.

Things are always clear in hindsight. After the smoke of battle clears, you can see right where the bottom was. But it is not clear when you are in the thick of it. I erred by committing much of my dry powder trading funds too early, maybe halfway through the big drop. C’est la vie. It’s hard to improve on that for next time. But a significant learning, that I will act on during the next panic, was how differently short vol versus leveraged stocks recovered from the crash. They both plunged and recovered, but leveraged stocks recovered much better.

It turns out that much of the time, the price movements over say a six-month period of SVXY and SSO largely match each other, so these are useful for comparisons for trading short vol versus leveraged stocks. For instance, below is a chart of SVXY (orange line) and SSO (green line) over the past six months or so. The blue arrow notes the April crash, which bottomed roughly April 8. For November through early April, the price movements of the two funds roughly matched. By April 8, both had plunged to a level some 35% lower than their starting prices. However, by May 12, SSO had recovered to -10% (relative to starting), which is about where it was in late March (green level line drawn in). SVXY, however, remained 21% below its start.

Chart of SVXY ( -0.5X VIX ETF, Orange line) and SSO (2X Stock fund, green line), Nov 2024-May 2024. Blue arrow marks April 2025 volatility spike/stock crash. Chart from Seeking Alpha.

Thus, from its nadir (-35%) to its recovery as of Tuesday, May 12, SSO gained by 38% (i.e., ratioing 0.90/0.65), whereas SVXY gained only 21% (from ratioing 0.79/0.65). Also, it looks like SVXY will not regain its earlier price levels any time soon. So SSO looks like the winner here.

We can do a similar comparison between the -1X VIX fund SVIX and the 3X stock fund UPRO. These two funds are plotted below, along with a plain (1X) S&P 500 stock fund, SPY (in blue). SVIX (orange) and UPRO (green) trend pretty closely for October through March. When the April crash came, SVIX dropped much harder, down to a heart-stopping -59%, compared to -44% for UPRO. SPY dropped only to -15%.  SPY comes to a full recovery (0%) by May 12, while UPRO recovers only to -13% [1].    SVIX has recovered only to -21%. If you managed to buy each of these funds on April 8, and sold them today, you would have made the following gains:

SPY 17% ; UPRO 55%;  SVIX  43%.    Clearly the winner here in short term trading of the April crash is the 3X stock fund UPRO.

Chart of SVIX ( -1X VIX ETF, Orange line), UPRO ( 3X Stock fund, green line), and SPY (1X Stock fund, blue line), Oct 2024-May 2024. Chart from Seeking Alpha.

As a cross check, below is a plot of SVXY (orange) and SSO (green) covering the August, 2024 volatility spike. This was a peculiar event, discussed here, where volatility went crazy for a couple of days, while stock prices experienced only a moderate drop. If (!!!) you timed it just right, and bought at the bottom and sold a week or so later, you could have made good money on SVXY. But zooming out to the larger picture, SVXY never came close to recovering its old highs, whereas SSO just kept going up and up (green arrow). So SSO seems like a safer trading vehicle: it is a reasonable buy-and-hold, whereas SVXY may be hazardous to your portfolio’s health if you don’t get the timing perfect.

Chart of SVXY ( -0.5X VIX ETF, Orange line) and SSO ( 2X Stock fund, green line), Oct 2023-Oct 2024. Blue arrow marks early August 2024 volatility spike. Chart from Seeking Alpha.

Over certain longer (say one-year) periods, there are regimes where short vol could out-perform leveraged stocks (discussed earlier), but that is the exception, rather than the rule.

Disclaimer: Nothing here should be considered advice to buy or sell any security.

ENDNOTE

 [1] While UPRO changes X3 the change of SPY on a daily basis, for reasons discussed earlier, the longer-term performance of UPRO diverges from a simple X3 relationship with SPY. In volatile times, UPRO tends to fall well below a 3X performance over say a six-month period.

Discuss AI Boom with Joy on May 12

I’m not just doing this to plug my own event. It’s also about the only thing on my mind after spending the week leading and moderating this timely discussion.

If you like to read and discuss with smart people, then you can make a free account in the Liberty Fund Portal. If you listen to this podcast over the weekend: Marc Andreessen on Why AI Will Save the World  (2023) you will be up to speed for our asynchronous virtual debate room on Monday May 12.

Keeping in mind the stark contrast between this and the doomers we discussed in the past week, here is Marc’s argument in a nutshell:

“The reason I’m so optimistic is because we know for a fact–as sort of one of the most subtle conclusions in all of science–we know for a fact that in human affairs, intelligence makes everything better. And, by “everything,” I mean basically every outcome of human welfare and life quality that essentially we can measure.”

When it’s put that way, it’s hard to disagree. Who would want less intelligence?

See more details on all readings and the final Zoom meeting in my previous post.

Another interesting bit by Marc:

“By the way, look: there’s lots of work happening that’s not being published in papers. And so, the other part of what we do is to actually talk to the practitioners.”

Even though it might seem strange to look to podcasts instead of published books and papers for cutting edge information, it really does seem like the story was told in human voices for the past 3 years. Dwarkesh was probably the best, but Tyler and Russ deserve credit as well for bringing these conversations out of the closed rooms and into the public domain.

What is truth? The Bayesian Dawid-Skene Method

I just learned about the Bayesian Dawid-Skene method. This is a summary.

Some things are confidently measurable. Other things are harder to perceive or interpret. An expert researcher might think that they know an answer. But there are two big challenges: 1) The researcher is human and can err & 2) the researcher is finite with limited time and resources. Even artificial intelligence has imperfect perception and reason. What do we do?

A perfectly sensible answer is to ask someone else what they think. They might make a mistake too. But if their answer is formed independently, then we can hopefully get closer to the truth with enough iterations. Of course, nothing is perfectly independent. We all share the same globe, and often the same culture or language. So, we might end up with biased answer. We can try to correct for bias once we have an answer, so accepting the bias in the first place is a good place to start.  

The Bayesian Dawid-Skene (henceforth DS) method helps to aggregate opinions and find the truth of a matter given very weak assumptions ex ante. Here I’ll provide an example of how the method works.

Let’s start with a very simple question, one that requires very little thought and logic. It may require some context and social awareness, but that’s hard to avoid. Say that we have a list of n=100 images. Each image has one of two words written on it, “pass” and “fail”. If typed, then there is little room for ambiguity. Typed language is relatively clear even when the image is substantially corrupted. But these words are written, maybe with a variety of pens, by a variety of hands, and were stored under a variety of conditions. Therefore, we might be a little less trusting of what a computer would spit out by using optical character recognition (OCR). Given our own potential for errors and limited time, we might lean on some other people to help interpret the scripts.

Continue reading →

“How Can the US Manufacture More” Is a Reasonable Question That Deserves Reasonable Answers

Many regular Americans and policymakers say they want the US to manufacture more things domestically. But when they ask economists how to accomplish this, I find that our most common response is to question their premise- to say the US already manufactures plenty, or that there is nothing special about manufacturing. It’s easy for people to round off this answer to ‘your question is dumb and you are dumb’, then go ask someone else who will give them a real answer, even if that real answer is wrong.

Economists tell our students in intro classes that we focus on positive economics, not normative- that we won’t tell you what your goals should be, just how best to accomplish them. But then we seem to forget all that when it comes to manufacturing. Normally we would take even unreasonable questions seriously; but I think wondering how to increase manufacturing output is reasonable given the national defense externalities.

So if you had to increase the value of total US manufacturing output- if you were going to be paid based on a fraction of real US manufacturing output 10 years from now- how would you do it?

I haven’t made a deep study of this, but here are my thoughts. Better ideas at the top, ‘costly but would increase manufacturing output’ ideas at the bottom:

Continue reading →

The Middle/Working Class Has Not Been “Hollowed Out”

Claims that the middle class or working class has been “hollowed out” in the US have been made for years, or decades really. The latest claim is an essay in the Free Press by Joe Nocera. But these claims are usually lacking in data, while strong in anecdotes. Let’s look at the data.

One data point we might use is median weekly earnings for full-time workers with a high school diploma, but no college degree. That sounds like a reasonable definition of “working class.” Here’s what that data looks like adjusted for inflation with the PCE Price Index:

Notice that the latest data point is for 2024, which is the highest they have ever been in this data series, and likely higher than any point in the past. While many point to about the year 2000 as when troubles for the working class started (this is when manufacturing employment really fell off a cliff, and China joined the WTO in 2001), inflation-adjusted earnings have risen 11% for this group of workers since then. You might say that’s not a lot of growth — and you would be correct! But this group is better off economically than in the year 2000, which is a point that gets lost in so many discussions about this issue.

But that’s just a national number. Might some states that were especially hit by manufacturing job losses be worse off? Nocera mentions North Carolina and the Midwest. To answer this, we can use BLS OEWS data, which has not only median wages by state, but also the 10th percentile wage — the lowest of the working class. Here’s what median real wage growth (again inflation-adjusted with the PCEPI) since 2001 (the earliest year in this series with comparable data):

Continue reading →