Russia, The US, and Crude Data

Overall, I’ve been disappointed with the reporting on the US embargo against Russian oil. The AP reported that the US imports 8% of Russia’s crude oil exports. But then they and other outlets list a litany of other figures without any context for relative magnitudes. Let’s shine some more light on the crude oil data.*

First, the 8% figure is correct – or, at least it was correct as of December of 2021. The below figure charts the last 7 years of total Russian crude oil exports, US imports of Russian crude oil, and the proportion that US imports compose.  That 8% figure is by no means representative of recent history. The average US proportion in 2015-2018 was 7.8%. But the US share as since risen in level and volatility. Since 2019, the US imports compose an average of 11.9% of all Russian crude oil exports.

As an exogenous shock, the import ban on Russian crude oil might have a substantial impact on Russian exports. However, many of the world’s oil importers were already refusing Russian crude. The US ban may not have a large independent effect on Russian sales and may be a case of congress endorsing a policy that’s already in place voluntarily.

Continue reading →

FTX Future Fund

Crypto is a lot of things- a store of value, a means of payment, a building block for other tools on the web. But while much of its value as a tool is yet to be realized, one big effect we see already is that it has made a lot of nerds very rich very young, even by the standards of tech and finance generally. These newly minted millionaires and billionaires have started giving their money away in very different ways than the traditional older philanthropists.

The latest, and I believe biggest example is the FTX Future Fund. It plans to give away at least $100 million this year, funded primarily by 30-year-old Sam Bankman-Fried, the CEO of crypto exchange FTX. I recommend that everyone read their full list of the 35 types of projects that they’d like to fund, but I’ll highlight a few you wouldn’t see from older foundations:

Demonstrate the ability to rapidly scale food production in the case of nuclear winter

Biorisk and Recovery from Catastrophe

In addition to quickly killing hundreds of millions of people, a nuclear war could cause nuclear winter and stunt agricultural production due to blocking sunlight for years. We’re interested in funding demonstration projects that are part of an end-to-end operational plan for scaling backup food production and feed the world in the event of such a catastrophe. Thanks to Dave Denkenberger and ALLFED for inspiring this idea

Prediction markets

Epistemic Institutions

We’re excited about new prediction market platforms that can acquire regulatory approval and widespread usage. We’re especially keen if these platforms include key questions relevant to our priority areas, such as questions about the future trajectory of AI development.

Critiquing our approach

Research That Can Help Us Improve

We’d love to fund research that changes our worldview—for example, by highlighting a billion-dollar cause area we are missing—or significantly narrows down our range of uncertainty. We’d also be excited to fund research that tries to identify mistakes in our reasoning or approach, or in the reasoning or approach of effective altruism or longtermism more generally.

They also seem to be borrowing some of Tyler Cowen’s approach to Fast Grants and Emergent Ventures- the application is relatively short and simple, and they promise response times that will be measured in weeks, rather than the months or years typical of large funders.

But they expect applicants to be fast too- this fund was just announced a few days ago, and applications are due March 21st. Economists will be natural fits for some of their project ideas, since their areas of interest include “economic growth” and “epistemic institutions”. I’ll be applying with my book project on why US health care spending is so high. But they are clearly casting a wide net to find the best ideas, so I encourage everyone to check it out and consider applying.

Gas Prices are High — But Don’t Adjust Them for Inflation!

Gasoline prices are high and rising. Anecdotally, they seem to be increasing at the pump by the hour. And indeed, in nominal terms they are now the highest they have ever been in the US (this is true with both the AAA daily price level and the EIA weekly price level). At over $4.10 per gallon, the price now exceeds the peaks briefly hit in 2008, 2011, and 2012. And it’s looking like this peak might not be so brief.

But we all know you can’t compare nominal dollars over long periods of time. We need some context for this price! Plenty of news stories provide what they think is the right context: adjust it for inflation! For example, USA Today reports that today’s price “would come to around $5.25 today when adjusted for inflation.”

$5.25: that’s a pretty concrete number. But it’s not really useful. OK, so clearly that’s higher than the current price, about 20% higher in fact. Still, it doesn’t really give us the right context.

As I argued in a previous post on housing costs, inflation adjustments aren’t always the best way to contextualize a historical number. Yes, when you want to compare income or wages over time, it’s good to adjust for inflation. It’s necessary, in fact. And a good economist will always do that.

However, when comparing particular prices over time, it doesn’t really make sense to adjust for other prices. All you are really saying is “if the price of gasoline increased at the same rate as the average price level, here’s what it would be.” Perhaps slightly useful, but it doesn’t really get at the thing we’re really try to address: is gasoline more or less affordable than in the past?

The best approach is to adjust the prices for changes in wages or income. Which measure of wages or income you choose is important, but it’s the best adjustment to make. No need to make any inflation adjustments, are worrying about whether the index you choose is properly accounting for quality changes, substitution effects, etc. If you want to know how affordable something is, compare it to income.

Here’s what I think is the best simple comparison for gasoline, which I’ll explain it below. In short, it tells us how many minutes the average worker would need to work to purchase one gallon of gasoline.

Since the price of gasoline is rising sharply every day lately, my chart will surely be out of date very soon. But right now, it’s the most current data I could provide with a comparable historical series: EIA weekly data current through March 7th, 2022 (Monday). We can see that at current prices, it takes about 9 minutes of work at the average wage to purchase a gallon of gasoline. At the peak in 2008, it took over 13 minutes of work to purchase a gallon, and it fluctuated between 10 and 12 minutes of work for much of 2011-2014.

Continue reading →

How Overzealous Green Policies Force Europe to Bankroll Putin’s Military

There is a difference between healthy zeal for a basically good cause like reducing CO2 emissions, and unbalanced myopia. Back in September I wrote about the European power debacle (skyrocketing gas and electricity prices):

Shut down your old reliable coal and nuclear power plants. Replace them with wind turbines. Count on natural gas fueled power plants to fill in when the breeze stops blowing. Curtail drilling for your own natural gas, and so become dependent on gas supplied by pipeline from Russia or by tankers chugging thousands of miles from the Middle East. What could possibly go wrong?

Well, now we know what can go wrong.

In January I noted more specifically, “This energy shortage also makes Europe very vulnerable to Russia, at a time when Putin is menacing Ukraine with invasion.” Now it has come to pass. All the huffing and puffing about economic sanctions on Russia is mainly just hot air. Because Europe is utterly dependent on Russian gas, massive “carve-outs” have been made in sanctions in order to continue these purchases to continue. The vaunted SWIFT restrictions on Russian banks have been carved down to practical irrelevance. While sanctions may impact the lifestyles of oligarch playboys, this flow of euros to Russia ensures that Putin will not run short of money for his war.

Ecomodernist Michael Shellenberger writes that behind the Ukraine military drama “is a story about material reality and basic economics—two things that Putin seems to understand far better than his counterparts in the free world and especially in Europe.” Shellenberger asks, “How is it possible that European countries, Germany especially, allowed themselves to become so dependent on an authoritarian country over the 30 years since the end of the Cold War?” and then answers this question in his trademark style:

Here’s how: These countries are in the grips of a delusional ideology that makes them incapable of understanding the hard realities of energy production. Green ideology insists we don’t need nuclear and that we don’t need fracking. It insists that it’s just a matter of will and money to switch to all-renewables—and fast. It insists that we need “degrowth” of the economy, and that we face looming human “extinction.” (I would know. I myself was once a true believer.)

… While Putin expanded Russia’s oil production, expanded natural gas production, and then doubled nuclear energy production to allow more exports of its precious gas, Europe, led by Germany, shut down its nuclear power plants, closed gas fields, and refused to develop more through advanced methods like fracking.

The numbers tell the story best. In 2016, 30 percent of the natural gas consumed by the European Union came from Russia. In 2018, that figure jumped to 40 percent. By 2020, it was nearly 44 percent, and by early 2021, it was nearly 47 percent.

…The result has been the worst global energy crisis since 1973, driving prices for electricity and gasoline higher around the world. It is a crisis, fundamentally, of inadequate supply. But the scarcity is entirely manufactured.

Europeans—led by figures like Greta Thunberg and European Green Party leaders, and supported by Americans like John Kerry—believed that a healthy relationship with the Earth requires making energy scarce. By turning to renewables, they would show the world how to live without harming the planet. But this was a pipe dream. You can’t power a whole grid with solar and wind, because the sun and the wind are inconstant, and currently existing batteries aren’t even cheap enough to store large quantities of electricity overnight, much less across whole seasons.

In service to green ideology, they made the perfect the enemy of the good—and of Ukraine.

There we have it.  It’s not just the Europeans. As I write this, shells are raining down on Ukrainian cities but the U.S. is not restricting its imports of Russian oil, lest our price of oil go even higher. The present oil shortage (even before the Ukraine invasion) is what happens when a president on his first day in office signs an executive order to cancel a pipeline expansion which would have enabled increased oil production from Canada’s massive oil sands, and the whole ESG movement hates on investing in projects for producing oil or gas.

All that said, what the West gives with one hand it may take back with the other. Although energy exports from Russia are theoretically permitted, Western private enterprises, including finance arms, are pulling back from any dealings with Russia. This means in practice, lots of wrenches are being thrown into the machinery of international finance, such that energy exports from Russia are being slowed, though not stopped. But in turn, the Russians are getting higher prices per barrel for the oil that does get exported. There are many moving parts to all this, so we will see how it all shakes out.

Two Decades of Real Estate Data

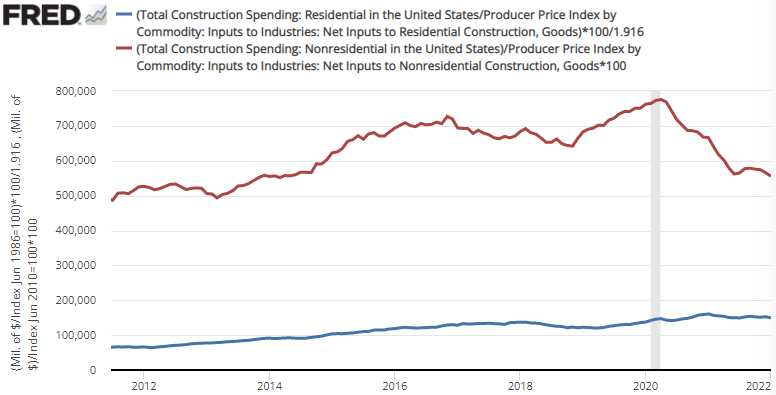
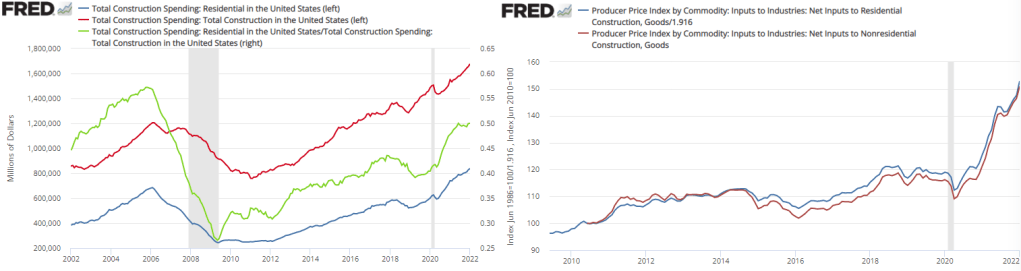
Total spending on real estate construction has been rising since 2011. By 2016 it had reached its previous 2006 peak. However, total spending on *residential* real estate construction didn’t reach its previous 2006 peak until November of 2020. The graph below also includes the proportion of residential construction spending (Green). It has been rising since 2009. In and of itself, nothing is good or bad about this figure. We might be spending less on non-residential construction because we are getting better at using less land per unit of good or service produced. Or, it could be that our real investment in future production is falling relative to our current residential consumption.  Regardless, the share of residential construction hasn’t been at this level since 2003.

Importantly, the difference in spending has not been driven by different construction costs. Both residential and non-residential construction costs have moved in tandem since 2010. Therefore, the rise in residential construction spending is not merely nominal – a greater proportion of resources are being consumed by residential construction. Indeed, real residential construction is up about 25% from 2019. The figure below illustrates real residential and nonresidential construction.

That figure requires a double-take.

Continue reading →

Lessons from a Failed Merger

The two largest hospital systems in Rhode Island, Lifespan and Care New England, wanted to merge. I wrote previously that:

Basic economics tells us that if a company with 50% market share buys a company with 25% market share in the same industry, they have strong market power and are likely to use this monopoly position to raise prices…. I think the Federal Trade Commission will almost certainly challenge the merger, and that they will likely succeed in doing so

It turns out I was right about the FTC challenge, but wrong that it would be necessary. The same day that the FTC challenged the merger, Rhode Island Attorney General Neronha blocked it. The law in Rhode Island is such that he doesn’t need to convince a judge like the FTC would; the merger was done unless the parties tried to appeal. But today they gave up and officially terminated the merger.

I was surprised by the AG’s move because the merging parties have so much political clout in the state, and many politicians like Senator (and former RI AG) Whitehouse had expressed support for the merger. I expected that even if state leaders didn’t like the merger, they would approve it with the expectation that the FTC would step in and be the bad guy for them. So AG Neronha blocking the merger was a pleasant surprise.

I also said previously that the FTC might challenge the merger for creating a monopsony (predominant employer of health care workers) as well as a monopoly (predominant provider of hospital services). This turned out to be one vote short of true. The FTC voted 4-0 to challenge the merger, but released two concurring statements explaining why. The two Democratic commissioners wanted to challenge the merger on both monopoly and monopsony grounds, while the two Republican commissioners thought it would only be a monopoly. This didn’t matter for this case, since they all thought it would be a monopoly, and since the AG blocked it. It was also odd that the Democratic FTC commissioners were more worried about labor than the actual unions involved. But it may be a sign of more monopsony challenges to come, particularly once the vacant spot gets filled and a 3rd Democrat is breaking the ties.

This was the first big political / economic issue I’ve got involved in since moving to Rhode Island, and I have to admit I was worried about making enemies. But despite speaking against the merger at the same forum as its most powerful proponents, speaking to several journalists, and at the AG’s public forum, I didn’t hear a single angry response; if anything I made friends.

One final surprise in all this is that the two hospitals systems are reported to have spent $28 million pursuing the merger. Apparently money can’t buy everything. But what a lot to spend on something that so many of us thought was clearly destined to fail.

The Taxman Comes for Homer

Last week I wrote about the Simpsons’ mortgage payment. In short, I found that using a reasonable assumption of Homer’s income, the median housing price, and the rate of interest, the Simpsons are likely paying less of their household budget on housing today than in the 1990s.

But what about the family’s taxes? Are they getting squeezed by the taxman? Taxes are referenced throughout The Simpsons series. Here’s an article that collects a lot of the references. And that makes sense: the Simpsons are a normal American family, and normal American families love to complain about taxes.

Using the same reasonable assumption about Homer’s income from last week’s post (that Homer earns a constant percentage of a single-earner family, rather than merely adjusting for inflation), we can calculate the family’s average tax rate and how it has changed over the year. Conveniently, “average tax rate” is just economist speak for “how much of your family’s budget goes to the government.”

First, let’s just look at the federal income tax, since this is where most of the changes happen. Don’t worry, I’ll add in payroll taxes below, though this is a constant percent of the family’s budget since it is a flat tax on income!

The chart below shows the average tax rate the Simpsons paid for their federal income taxes. I didn’t go through every year, because: a) it’s a lot of work (I’m doing each year manually); and b) it’s more interesting to look at years right after or before major changes in the tax code. So no cherry picking here — the years selected are picked to tell a mostly complete story.

I’ll now briefly explain each of the years chosen, and what changes in the tax code impacted the Simpsons. But as you can see, just like their mortgage payment, the Simpsons are now spending less of their household income on federal income taxes (don’t worry, the trend is similar with payroll taxes included). In fact, they are now getting a net rebate from the federal government, and have been since the late 1990s!

Continue reading →

How to Set Working Directory in R for Replication Packages

The AEA Data Editor kicked it all off with this tweet:

“Please stop using “cd” (in Stata) or “setwd()” (in R) all over the place. Once (maybe, not really), that’s enough.”

Replies proliferated on #EconTwitter this week. In this blog post I am collecting solutions for R.   These days you might share the code used to generate your results for an empirical paper. That code would ideally be easy for other people to run on their own computers. File paths are hard (as I blogged previously).

A project for a single paper might have multiple code files. The code interacts with data stored somewhere. Part of the task of the code is to point the statistical program to the data set. It is frustrating if an outsider is trying to replicate a result and must alter the code in multiple places to point to their own location of the data.

Here is a concise summary of good practice, for any code language: “cd and setwd() specify the directory. When you share code and run on a different computer, they don’t work. Therefore, good practice to only specify once, at the beginning”

Continue reading →

Inflation Empirics

Way back in the late 1970s and early 80s, Kydland and Prescott proposed rational expectations theory. This line of research arose, in part, because the Phillips curve ceased to describe reality well. Amid increasing inflation, people began to anticipate higher prices to a relatively correct degree when making labor, supply chain, and pricing decisions. Kydland and Prescott argued that individuals understand the rules of the game or how the world works – at least on average.

An increase in the money supply would increase total national spending, and increase demand for goods. However, firms also experienced increasing revenues and demanded more inputs such as commodities, capital, and intermediate goods. Because there were no greater productivity earlier in the supply chain, price roses. Firms began to understand that greater demand would eventually find its way to causing greater costs. Therefore, firms began raising prices before the cost of resources rose, increasing their willingness to pay for inputs and, ironically, hastening the increase in input prices. As a result, increases in the money supply began having substantial short-run price effects and negligible output effects.

However, assuming that people understand the rules of our economic system and ‘how the world works’ is hard to swallow. It is not at all clear that the typical economist understands monetary theory, much less clear that the typical person has a good understanding. Fortunately, another theory of expectations can help carry some of the load and achieve similar results.

Adaptive Expectations

Continue reading →

Economics of the Russia-Ukraine Conflict

Russia launched a full invasion of Ukraine last night. Most of the discussion I’ve seen has naturally focused on the fighting itself- what is happening, what is likely to happen, how did it come to this.

Since there are plenty of better sources to follow about that, I’ll simply offer a few observations on the economics of the conflict:

  1. Russia is not only more than 3 times as populous as Ukraine, it also more than twice as well off on a per-capita basis. This means its overall economy is more than 6 times the size of Ukraine’s. This gap has been growing since the fall of the Soviet Union, as Russia’s per-capita GDP growth has been much stronger, while its population has shrunk much less than Ukraine’s. Putting this together, Ukraine’s measured real GDP is actually smaller than it was in 1990, while Russia’s is larger.

2. Russia’s much larger economy allows it to spend much more on its military. Russia spends $60 billion per year, the 4th most of any country (after the US, China and India). Ukraine spends only $6 billion per year on its military. So Russia is starting with a big economic advantage here, though Ukraine has some of its own advantages, like fighting on their own ground and receiving more foreign support.

3. War is bad for business. Russian stocks are down 33% in a day, their biggest-ever loss; Ukraine shut down trading entirely, and their bonds are being hit even worse than Russia’s. Regardless of which side “wins” the fight for territory, both countries will be economically worse off for years as a result of the war.

4. Russia, though, expected that the war would lead to sanctions from the West that would harm their economy, and prepared for this by building up hundreds of billions of dollars worth of foreign reserves over many years.

5. US markets are down only slightly, much less than they would be if traders thought the US would get involved directly in the fighting. But this slight overall decline conceals huge swings. Companies that do business in Ukraine or Russia are big losers. But those that compete with Russian exports see their value rising given the expected sanctions. Because Russia’s biggest exports are oil and natural gas, the value of US-based oil & gas companies is rising, while alternatives like solar are also up substantially.

6. There is still some hope for Ukraine to expel Russian troops, but its not looking good, and even a victory would involve huge costs. This leaves people all over the world wondering, how did it come to this? How might future conflicts like this be avoided? There is of course a lot to say about military preparedness, nuclear umbrellas, and ways the West can impose costs on Russia as a deterrent. But what stands out to me is that a stagnant economy and shrinking population make a country weak and vulnerable. Ukraine has a worse economic freedom score than Russia; this combined with its relative lack of natural resources explains much of the stagnation. Political elites often focus on grabbing a large share of the pie, rather than growing the pie and risk empowering domestic opponents. But we’re now seeing how stagnation carries its own risks. A growing economy, and especially growing energy sources that don’t depend on hostile nations, is the path to independence and survival.