Tort law is interesting. You can argue that someone harmed you, and you can cite almost no legislation in the process. Torte law in the US uses case law – the precedent set by previous rulings in the context of social norms. But, what cases did the early cases cite? They also cited earlier cases and social norms, though we may no longer have a record. The beauty of tort law it allows for changing relative costs in prudence and negligence.
Can you imagine a legislature attempting to codify the appropriate amount of neglect by, say, a painter? The standards would quickly go out of date. The relative cost of resources including labor, communications, materials, and the price differences among competitors of differing quality all change over time. Multiply these factors by 20 and then again by the number of occupations and regions in a country. You will quickly see that legislating the appropriate degree of prudence and neglect through congress is a fool’s errand. The challenge is too complicated and the world changes too quickly. In fact, attempting to legislate definitions for neglect and prudence could even backfire and result in regulatory arbitrage, which occurs when firms comply with de jur rules while avoiding them de facto.*
My favorite two economists are Ludwig Von Mises and Milton Friedman. They might consider one another from very different schools of thought, though there is reason to think that they are not so different. As an undergraduate student, I liked them both, but I became more empirics-minded in graduate school and as a young assistant professor.
As I progressed through graduate school and conducted empirical research, my opinions and policy prescriptions changed and were refined from what they once were. In graduate school, I didn’t study Austrian Economics, though it was certainly in the water at George Mason University. Recently, as an assistant professor with a few years under my belt, I picked up Bureaucracy (1944) and read it as a matter of leisure.
Have access to clean water and a functioning sewer system is something that many Americans take for granted. Not all Americans, of course, especially those in rural areas not connected to an urban water system. But most Americans do. But how much is it worth?
It’s a hard question to answer. We know clean water and sewers probably have large effects on disease transmission. For example, Ferrie and Troesken (2008) looked at several major improvements in Chicago’s water system, and found that there were large declines in mortality from diseases like typhoid fever after the improvements (here’s an ungated working paper, with the much better title “Death and the City“). But the limits of earlier studies like this are that they primarily looking at a time series of mortality rate and relating this to some change in public infrastructure. A good attempt, but perhaps not convincing to everyone.
A better method would be to look at not mortality rates but property values. People are, surely, willing to pay more for a home with piped water and a sewer system. But how much more? Knowing this could give us better information on the value of the water systems. And that’s exactly what the authors of a new working paper do, once again visiting Chicago in the nineteenth century to look at how much property values increased after the installation of water and sewer systems. The paper is “The Value of Piped Water and Sewers” by Coury, Kitagewa, Shertzer, and Turner (ungated version).
The effects are huge. There most conservative estimate is that sewer and water systems doubled property values (a 110% increase), but the effect could be much larger (almost 4 times as much, if I am reading it correctly, under other reasonable assumptions).
People are willing to pay a lot for sanitation, it turns out.
A person’s optimal choice depends on what they know. To consume more ice cream? Or to consume more alcohol? It depends on what we know about the expected utility across time. If a person thinks that alcohol has few calories, then it is understandable that they would choose to drink rather than eat. The person might be totally wrong, but they are acting optimally contingent on their knowledge about the world. (FWIW, 4oz of ethanol has 262 calories and 4oz of typical ice cream has 228 calories.)
The case is analogous for good government policy. The best policy is contingent on accessing the distribution of knowledge that’s inside of multiple people’s heads. It’s not sensible to assert that a policy is suboptimal if the optimal policy requires knowledge that neither a single individual nor all people together have. Even if the sum of all knowledge does exist, it may not be possible to access it.
Economists like to tell their undergraduate classes that it doesn’t matter who you tax. But that’s contingent on 1) identical compliance costs among buyers and sellers and 2) identical relevant information. If a tax comes as a surprise to the buyer or the seller, then it absolutely matters who is taxed.
When I was in 1st grade in North Carolina, my class went on a field trip to a Christmas tree farm. We learned a bunch about maintaining the farm and we got to choose a pumpkin to take home. At the end of our visit we took turns perusing the gift shop. My mother had generously given me a dollar to spend and I was eager to spend it (I rarely had money to spend). Unfortunately, even in the early mid-90s, most of the things in the shop cost more than $1. So, I settled on purchasing some beef jerky that cost 99 cents.
I read 23 books in 2021, but none that were written in 2021. Tim Ferriss stopped reading new books deliberately but for me it just happened, something about this year made me want to hang out in the ancient world instead.
I read about how five thousand years ago the Indo-Europeans figured out how to ride horses and use wheels, and so ended up spreading their language to half the world. I read about the Bronze Age Collapse three thousand years ago. Also set three thousand years ago are the semi-mythical events of the Aeneid and the Odyssey; I particularly enjoyed Emily Wilson’s new translation of the latter. From two thousand years ago, Caesar’s Commentaries reads like an action-packed fantasy novel but gives real insight into history and strategy. It was also a good year to go back to the Biblical events of two to three thousand years ago, though I didn’t make it cover to cover.
Bueno de Mesquita, author of The Dictator’s Handbook, is a political scientist but his analysis is very much economic, in both the methods (rational choice & methodological individualism) and in the focus on material incentives as the main driver of behavior. The book is good as a manual for aspiring tyrants, but suprisingly great as an explanation for why many poor countries stay poor.
So overall compared to 2020 I don’t have many good books to share, apart from things like The Odyssey that you presumably already know about. The best new writing in 2021 probably isn’t happening in books at all, but in Substacks. Many bloggers switched to the Substack blogging/newsletter platform last year because it makes it easy to monetize their writing, while many professional journalists switched over as a way to keep being paid to write while enjoying near-complete editorial freedom. I recommend Byrne Hobart on finance and business strategy, and Razib Khan on history and genomics. Probably my favorite writing of 2021 was the return of Scott Alexander to blogging, now at Substack as Astral Codex Ten. He is also a great demonstration of just how much the monetization game has changed, as less than a year into the new Substack he is making enough money to start giving large amounts of it away.
Keeping a fixed price is a somewhat rare, but fascinating pricing strategy. It can even become part of the identity of the product. The most famous example was Coca-Cola, which sold a 6.5 ounce bottle for 5 cents from 1886 to 1959. It’s so famous that it has its own Wikipedia page! “Always 5 cents” became a marketing slogan for them. And while we may regard that time period as one of generally low inflation, consumer prices on average more than tripled from 1886 to 1959.
Probably the most famous recent example is Costco’s $1.50 hot dog and soda combo, which has been stable in price since 1985. Rumor has it that the founder of Costco once told the current CEO that he’d kill him if he raised the price of the hot dog. Since 1985, nominal median wages in the US have tripled, meaning that your Costco Hot Dog Standard of Living has also tripled.
The concept of nickel and dime stores and later dollar stores are similar concepts, but they aren’t necessarily selling the exact same products over time. Coca-Cola, Hot-N-Ready pizzas, and Costco hot dogs really are the same product from year-to-year, so these products stand out as amazing examples of price stability during periods of time when most prices were rising in nominal terms (other than new technologies).
What are some other examples of consistently stable prices?
I remember people talking about Covid-19 in January of 2020. There had been several epidemic scare-claims from major news outlets in the decade prior and those all turned out to be nothing. So, I was not excited about this one. By the end of the month, I saw people making substantiated claims and I started to suspect that my low-information heuristic might not perform well.
People are different. We have different degrees of excitability, different risk tolerances, and different biases. At the start of the pandemic, these differences were on full display between political figures and their parties, and among the state and municipal governments. There were a lot of divergent beliefs about the world. Depending on your news outlet of choice, you probably think that some politicians and bureaucrats acted with either malice or incompetence.
I think that the Federal Reserve did a fine job, however. What follows is an abridged timeline, graph by graph, of how and when the Fed managed monetary policy during the Covid-19 pandemic.
February, 2020: Financial Markets recognize a big problem
The S&P begins its rapid decent on February 20th and would ultimately lose a third of its value by March 23rd. Financial markets are often easily scared, however. The primary tool that the Fed has is adjusting the number of reserves and the available money supply by purchasing various assets. The Fed didn’t begin buying extra assets of any kind until mid-March. There is a clear response by the 18th, though they may have started making a change by the 11th. One might argue that they cut the federal funds rate as early as the 4th, but given that there was no change in their balance sheet, this was probably demand driven.
March, 2020: The Fed Accommodates quickly and substantially.
In the month following March 9th, the Fed increased M2 by 8.3%. By the week of March 21st, consumer sentiment and mobility was down and economic policy uncertainty began to rise substantially – people freaked out. Although the consumer sentiment weekly indicator was back within the range of normal by the end of April, EPU remained elevated through May of 2020. Additionally, although lending was only slightly down, bank reserves increased 71% from February to April. Much of that was due to Fed asset purchases. But there was also a healthy chunk that was due to consumer spending tanking by 20% over the same period.
In the 18 months prior to 2020, M2 had grown at rate of about 0.5% per month. For the almost 18 months following the sudden 8.3% increase, the new growth rate of M2 almost doubled to about 1% per month. The Fed accommodated quite quickly in March.
April, 2020: People are awash with money
Falling consumption caused bank deposit balances to rise by 5.6% between March 11th and April 8th. The first round of stimulus checks were deposited during the weekend of April 11th. That contributed to bank deposits rising by another 6.7% by May 13th.
By the end of March, three weeks after it began increasing M2, the Fed remembered that it really didn’t want another housing crisis. It didn’t want another round of fire sales, bank failures, disintermediation, collapsed lending, and debt deflation. It went from owning $0 in mortgage-backed securities (MBS) on March 25th to owning nearly $1.5 billion worth by the week of April 1st. Nobody’s talking about it, but the Fed kept buying MBS at a constant growth rate through 2021.
May, 2020 – December, 2021: The Fed Prevents Last-Time’s Crisis
Jerome Powell presided over the shortest US recession ever on record. The Fed helped to successfully avoid a housing collapse, disintermediation, and debt deflation – by 2008 standards. The monthly supply of housing collapsed, but it had bottomed out by the end of the summer. By August of 2021, the supply of housing had entirely recovered. The average price of new house sales never fell. Prices in April of 2020 were typical of the year prior, then rose thereafter. A broader measure of success was that total loans did not fall sharply and are nearly back to their pre-pandemic volumes. After 2008, it took six years to again reach the prior peak. A broader measure still, total spending in the US economy is back to the level predicted by the pre-pandemic trend.
The Fed can’t control long-run output. As I’ve written previously, insofar as aggregate demand management is concerned, we are perfectly on track. The problem in the US economy now is real output. The Fed avoided debt deflation, but it can’t control the real responses in production, supply chains, and labor markets that were disrupted by Covid-19 and the associated policy responses.
What was the cost of the Fed’s apparent success? Some have argued that the Fed has lost some of its political insulation and that it unnecessarily and imprudently over-reached into non-monetary areas. Maybe future Fed responses will depend on who is in office or will depend on which group of favored interests need help. Personally, I’m not so worried about political exposure. But I am quite worried about the Fed’s interventions in particular markets, such as MBS, and how/whether they will divest responsibly.
Of course, another cost of the Fed’s policies has been higher inflation. During the 17 months prior to the pandemic, inflation was 0.125% per month. During the pandemic recession, consumer prices dipped and inflation was moderate through November. But, in the 16 months since April of 2020, consumer prices have grown at a rate of 0.393% per month – more than three times the previous rate. Some of that is catch-up after the brief fall in prices.
Although people are genuinely worried about inflation, they were also worried about if after the 2008 recession and it never came. This time, inflation is actually elevated. But people were complaining about inflation before it was ever perceptible. The compound annual rate of inflation rose to 7% in March of 2021. But it had been almost zero as recent as November, 2020. That March 2021 number is misleading. The actual change in prices from February to March was 0.567%. Something that was priced at $10 in February was then priced at $10.06 in March. Hardly noticeable, were it not for headlines and news feeds.
It’s pumpkin spice season. That means that not only can you get pumpkin spice lattes, but also pumpkin spice Oreos, pumpkin spice Cheerios, and even pumpkin spice oil changes.
The most important thing to know about “pumpkin spice” things is that they don’t actually taste like pumpkin. They taste like the spices that you use to flavor pumpkin pie. (Notable exception: Peter Suderman’s excellent pumpkin spice cocktail syrup, which does contain pumpkin puree.)
Last week economic historian Anton Howes posted a picture of the spice shelf at his grocery store and guessed that this would have been worth millions of dollars in 1600.
Just thinking about how much this shelf would have been worth in England in the year 1600. Presumably at least tens of millions in today’s money. pic.twitter.com/Vc9HDBlQxL
Some of the comments pushed back a little. OK, probably not millions but certainly a lot. Howes was alluding to the well-known fact that spices used to be expensive. Very expensive. Spices, along with precious metals, were one of the primary reasons for the global exploration, trade, and colonialism for centuries. Finding and controlling spices was a huge source of wealth.
But how much more expensive were spices in the past? One comment on Howes’ tweet points to an excellent essay by the late economic historian John Munro on the history of spices. And importantly, Munro gives us a nice comparison of the prices of spices in 15th century Europe, including a comparison to typical wages.
As I looked at the list of spices in Munro’s essay, I noticed: these are the pumpkin spices! Cloves, cinnamon, ginger, and mace (from the nutmeg seed, though not exactly the same as nutmeg). He’s even included sugar. That’s all we need to make a pumpkin spice syrup!
Last week in my Thanksgiving prices post I cautioned against looking at any one price or set of prices in isolation. You can’t tell a lot about standards of living by looking at just a few prices, you need to look at all prices. So let me just reiterate here that the following comparison is not a broad claim about living standards, just a fun exercise.
That being said, let’s see how much the prices of spices have fallen.
In 1621 the pilgrims were starving after their communal farming system gave them little incentive to work hard, leading them to rely on the generosity of their native neighbors at the first Thanksgiving. But in the long run they were able to produce their own feasts after switching to a private property system. Economist Ben Powell tells the story briefly here, or you can read the primary source, William Bradford’s Diary here.
It is customary in many families to “give thanks to the hands that prepared this feast” during the Thanksgiving dinner blessing. Perhaps we should also be thankful for the millions of other hands that helped get the dinner to the table: the grocer who sold us the turkey, the truck driver who delivered it to the store, and the farmer who raised it all contributed to our Thanksgiving dinner because our economic system rewards them
Powell calls this “the real lesson of Thanksgiving”, and while I think there are other great angles to the story this is certainly a real lesson of Thanksgiving.
This weekend I’ll be at the Southern Economic Association Conference in Houston Texas. I’m organizing and chairing a session called Education Policy Impacts by Sex (you should come by and see me if you will be there too!).
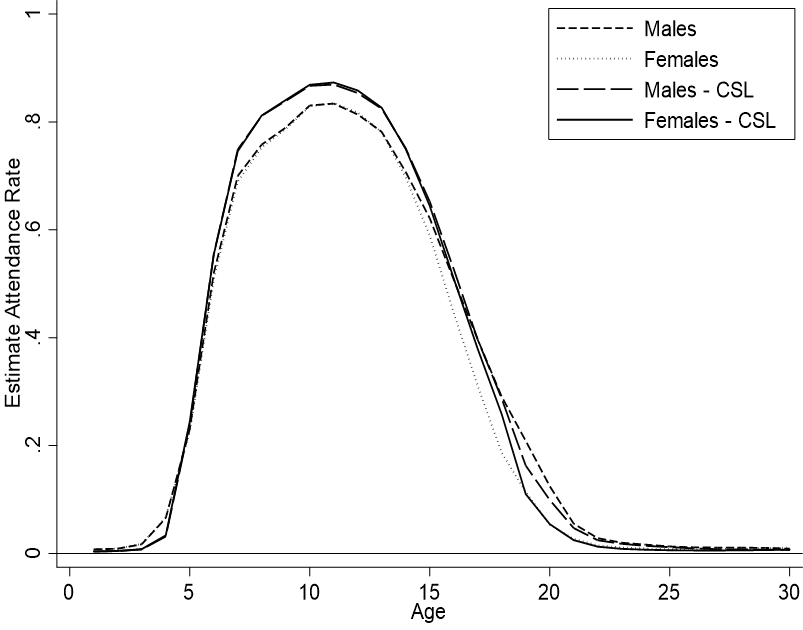
Personally, I will be presenting on the impact of compulsory school attendance laws on attendance. Today I just want to share and discuss a single graph that’s not my presentation.
Prior to my research, there was already a canon of existing literature on compulsory attendance legislation (CSL) and I’ve previously written on this blog about it (attendance, CSL, and differences by sex). However, the literature had some limitations. Authors examined smaller samples, ignored gender, or ignored different effects by age.
I examine full-count IPUMS data from the 1850-1910 US censuses of whites in order to investigate the so-far-omitted margins mentioned above. Here are some conclusions:
Prior to CSL:
Males and females attended school at similar rates until the age of 14.
After 14, women stopped attending school as much as men.
By the age of 18, the attendance gender gap was 10 percentage points.
After CSL
Male and female attendance increased from the ages of 6 to 14
Women began attending school more than prior to CSL until about age 18.
After the age of 18, women experienced no greater attendance than previously.
But, both sexes attended school less than prior to CSL for ages 5 and younger.
Men began attending school less after the age of 17.
CSL increased lifetime attendance for both males and females
Overall, examining the impact of CSL across many ages allows us to see when and not just whether people attended more school. Previous authors would say something like “CSL increased total years of school by about 5% on average”. For men, almost all of those gains were between the ages of 6 & 16. But women experienced greater attendance from ages 6 to 18.
Additionally, examining the data by age reveals that there was some intertemporal substitution. Once it became legally mandatory for children to attend school between the ages of 6 & 14, parents began sending their younger children to school at lower rates. Indeed – why invest in education for two or three early years of life if you’ll just have to send your children to school for another eight years anyway. Older boys dropped out of school at higher rates after CSL too. Essentially, the above figure became compressed horizontally. People ‘put in their time’, but then reduced investments at non-mandatory ages.
This reveals a shortcoming of the current literature, which focuses mostly on 14 year olds. By focusing on a popular age of attendance that was also compulsory, previous authors have missed the compensating fall in attendance at other ages. Granted, the life-time effect is still positive – but it’s attenuated by a richer picture. The picture reveals that individuals were not attending school by accident. Students or their parents had in mind an amount of educational investment for which they were aiming. When children were forced to attend school at particular ages, the attendance for other ages declined.