In July of 1992, the Barenaked Ladies released their debut studio album Gordon, which included one of their most popular songs: “If I Had $1000000.” Considering all the inflation we’ve had recently, you know that $1 million doesn’t buy as much as it did in 1992, but how much less? As measured by the Consumer Price Index in the US, prices have roughly doubled since 1992, meaning you would need about $2 million to buy the same amount of stuff as in 1992.
(Note: the Barenaked Ladies are Canadian, and prices in Canada haven’t quite doubled since 1992, but this song was included on early demo tapes in 1988 and 1989 released in Canada, and prices have roughly doubled there since then.)
So the value of a dollar that you held since 1992 has lost roughly half of its purchasing power. That’s bad. But how bad is it? What’s the normal US experience for how long it takes for prices to double?
It turns out that even with the recent huge run-up in inflation, we just lived through the lowest period of inflation for anyone alive today.
In previous blog posts, I’ve used the Simpsons as an example of a typical family to use for historical comparisons. In a post on mortgage payments, I found that it’s slightly easier to make a mortgage payment on Homer’s salary than in the early 1990s. In a post on taxes, I showed that the Simpsons now pay a much lower average tax rate than they did in the 1990s (guess all those tax cuts didn’t just go to the rich!).
Now, the Simpsons and economics are back at the front of the discourse about standards of living. The 33rd season finale of the show is all about whether the middle class can get by economically these days. And Planet Money’s “The Indicator” podcast (great program!) has a podcast about the show, which is a follow-up to a similar podcast last year called “Are The Simpsons Still Middle Class?” (apparently part of the influence for the recent Simpsons episode).
In that podcast from last year, they say “Tuition has more than doubled. Health care costs have more than doubled. I believe housing costs have more than doubled.” And they follow-up, for good measure with “Even after adjusting for inflation, college tuition has more than doubled since ‘The Simpsons’ started.”
Since we’ve already looked at housing costs for Homer, let’s look at the potential college costs for Bart. I’m going to assume Lisa will be fine, probably getting a free-ride (and a hot plate!) to one of the Seven Sisters or maybe even Harvard. But if Bart wants to go to college, the Simpsons will probably be paying out of pocket.
An important factor to consider when looking at college prices is not just the “sticker price,” or the published price, but to also look at what is known as the “net price.” The net price takes into account the average amount of aid that a student receives. This is important to consider at any time, but especially for data in more recent years since discounting has become a major part of the college pricing landscape. For example, at private colleges the average discount is now over 50%, with some colleges essentially giving some discount to 100% of students (in other words, at some colleges no one actually pays the sticker price). Discounting at public colleges isn’t quite as out-of-control as private colleges, but it’s still a major part of college pricing.
And no doubt Bart Simpson would be going to a traditional public, four-year college. Probably Springfield University, just like his old man (though Homer attended as an adult), located right in their town of Springfield. So what has happened to tuition prices since the early 1990s.
One of the best publications on college prices is the College Board’s annual report “Trends in College Pricing.” The report is broken down by type of college, it shows what factors (tuition, housing, etc.) make up the typical cost of college, and even shows differences across US states. Importantly, they include that “net tuition and fees” number, and they’ve been doing so since their 2003 report. That 2003 report even calculated the net figures back to the 1992-93 school year, perfect for an example of the early Simpsons (“Homer Goes to College” aired in 1993).
In the 1992-93 academic year, the average net tuition and fees, plus room and board for public four-year colleges in the US was $4,620 (from Figure 7, adjusted back to nominal dollars). In the 2020-21 academic year, the same figure was $15,050 (from Figure CP-9). Adjusted for inflation, that’s roughly a doubling (slightly less, but in the ballpark) since the early 1990s, just as Planet Money stated.
But let’s compare the cost of college to Homer’s income. In 1992, the median male with a high school education, working full-time earned $26,699, meaning that the cost of college would be 17.3% of his income that year. In 2020, the median male with a high school education, working full-time earned $49,661, meaning that the cost of college would be 30.3% of his income.
By this measure, college clearly has become much more expensive when compared to a Homer Simpson-type salary, and 30% of your income is a very hard pill to swallow (though the 17% in 1992 wasn’t a picnic either). But here’s one other factor to consider. The College Board data also allows us to look only at net tuition and fees, rather than also including the cost of room and board. Remember, Springfield University is located in Springfield, and Bart has a perfectly fine room at the house on Evergreen Terrace. While living on campus is certainly a big part of the college experience, and no one would probably love that experience more than Bart Simpson, many students today do choose to live with their parents while attending college (or at least live off-campus, where housing is often cheaper).
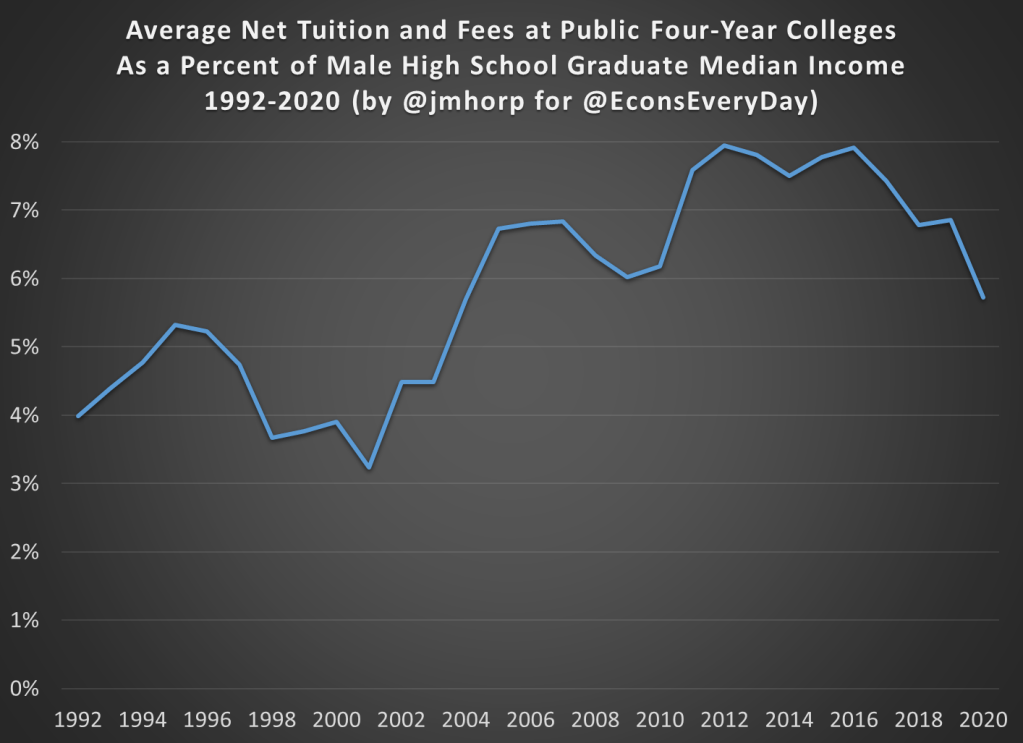
If we just look at net tuition and fees (not room and board), in 1992-93 the average cost at public four-year colleges was about $1,065 (in nominal dollars). That’s about 4% of Homer’s annual income. Much more reasonable! In 2020-21, that same figure was $2,880 (once again, in nominal dollars), or just under 6% of annual income. That’s certainly more than 4%, but not exactly the kind of expense that would break the budget if planned for.
I want to repeat that number again: $2,880. That was the average cost of tuition and fees at an in-state, four-year, public college in the US in 2020-21, after accounting for grants and aid. I suspect this number is much, much lower than most would guess.
The chart below does the same calculation for all the years I could find (1992-2020) using archived versions of the College Board’s report. I’ll admit the data isn’t perfect, as later reports sometimes have different numbers than earlier reports, but it’s probably the best we can do if we want a consistent time series. There does seem to be a break happening in the early 2000s, when college suddenly did get more expensive relative to a high school graduate’s income, though in the past 15 years it’s been pretty flat.
We should keep in mind that if Bart were to take out the maximum federal student loan amount of $9,000 as a dependent student in his first year at Springfield University, he is primarily borrowing money to pay for his housing and food, not his education.
In 1993, the premium for getting a college degree was about 54%, with the median male college grad earning about $41,400 and the equivalent high school grad earning about $26,800 (data from Table P-24). In 2021, that premium had risen to about 64%, with the median male college grad earning $81,300 compared with his high school counterpart earning about $49,700.
I’m ignoring all sorts of important questions here about what is causing the difference in pay. Is it signaling, human capital, something else, or some combination of all these? Yes. But regardless of your preferred explanation for the college wage premium, there’s pretty solid evidence of a sheepskin effect.
Putting It All Together
I’ve now explored taxes, housing, and college education prices using a family like the Simpsons. But what if we put it all together? How are high school graduates doing?
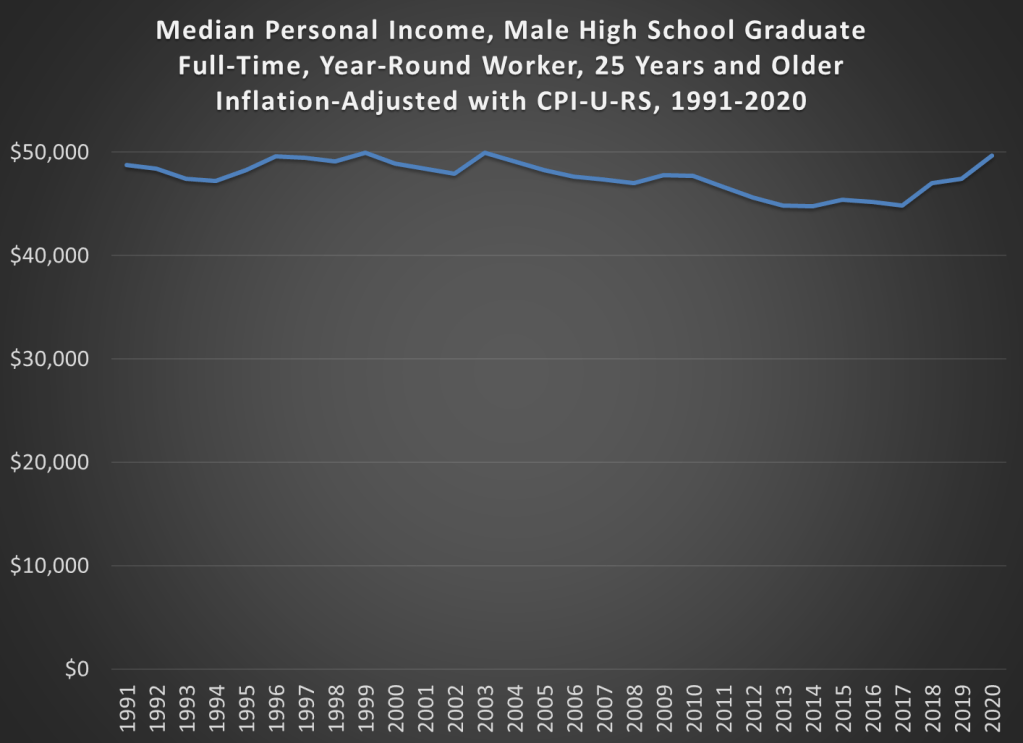
The best way to do this is probably the simple chart you’ve been thinking of all along: median income adjusted for inflation. Some things have gotten cheaper (housing, TVs), some more expensive (college, probably healthcare), but to get a sense of the total effect, we need to adjust for all prices. The chart below is that calculation, using Census data on median earnings for full-time, year-round workers, male high school graduates aged 25 and older. The data starts in 1991. You can get some earlier estimates from different data series, but if we want a consistent series 1991 is the best we can do.
And from the chart we see that real incomes of male high school graduates are… pretty flat. That’s not good, but let’s contextualize. First, claims that it’s harder for these workers to make ends meet aren’t true. It’s roughly no easier, but also no harder. Definitely wage stagnation, but also not “falling behind.”
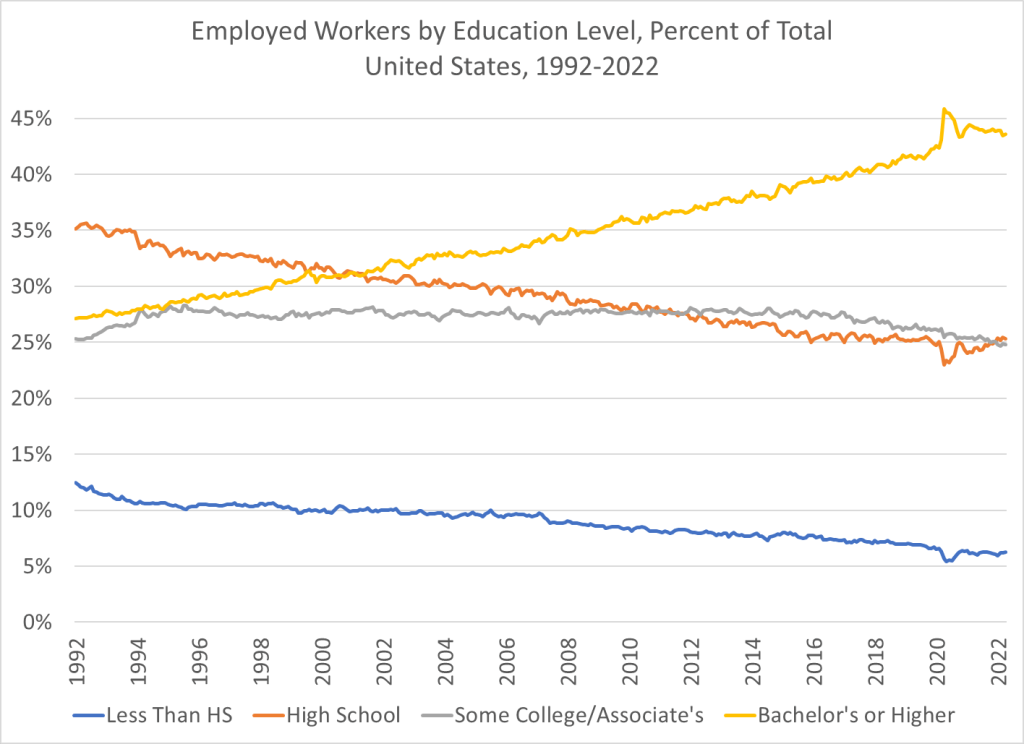
And also, high school graduates are a shrinking part of the workforce in the United States. You probably already knew this. But it wasn’t until after the year 2000 that college grads became the largest category of workers in the US. In the early 1990s, high school graduates (folks like Homer) were by far the largest single category of workers. Now, it’s by far college graduates, and those with some college or a 2-year degree are roughly equal in size to high school graudates. So, while the income stagnation we see for high school grads is not good, it’s affecting a shrinking portion of workers in the US.
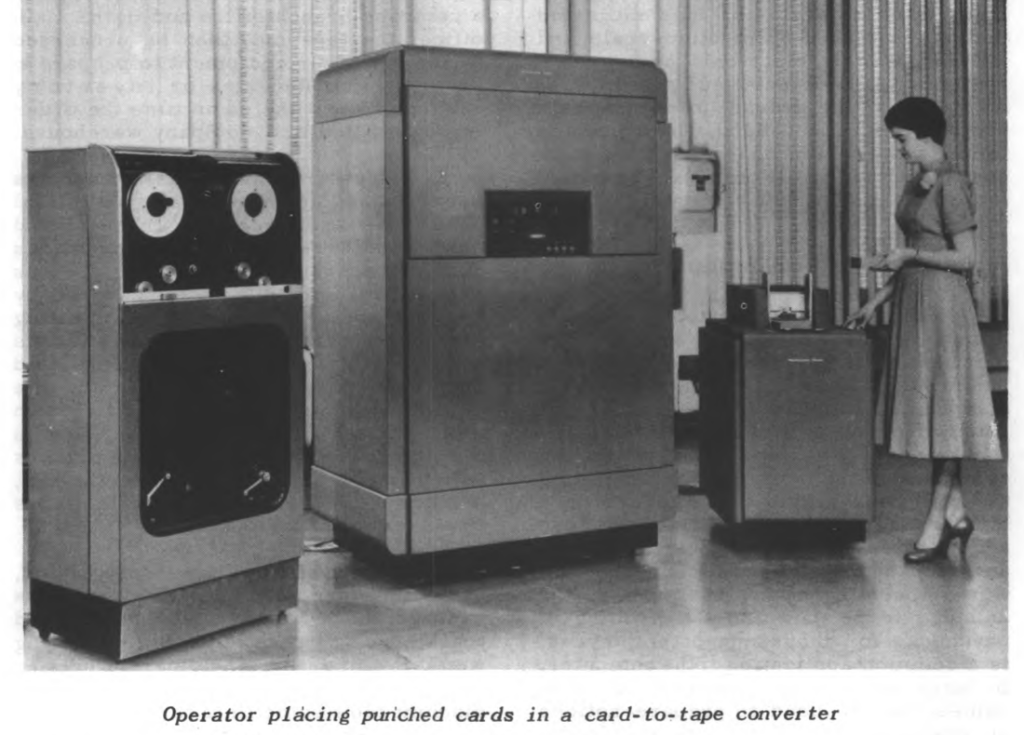
Courtesy of the St. Louis Fed, you can download a report published in 1958 titled “Automation and Employment Opportunities for Office-Workers: A Report on the Effect of Electronic Computers on Employment of Clerical Workers, with a Special Report on Programmers.”
I teach students about data and software to prepare them to enter the hot field of business analytics. It has been a growing field for a few years, especially since the advent of “Big Data”. Something I explain in class is how brand-new technology has changed business.
Reading this report forced me to re-think just how new data analytics is. The authors saw machines in use for data processing and correctly predicted that this would be a dynamic source of new jobs.
The introduction states that millions of “clerical workers” were employed in the United States. That fact would have been obvious at the time, but today we might not realize just how many humans would be needed to store and fetch the files we access regularly on our computers. The creation of clerical jobs was especially important for women.
In view of the volume of work that needed to be done, installing new computers was economical. “A computer system can automatically do such jobs as prepare payrolls for thousands of employees, control inventory on a multitude of items…”
“Although computers are often described as machines that can “think,” that is, of course, not so. Like other machines, they must be operated or controlled by people… The people who prepare the instructions are called programmers.”
“Electronic computers were developed during World War II as an aid in solving intricate scientific and engineering problems such as gunfire control, but their application to the processing of office data is more recent. The Federal Government lead the way in 1951, when an electronic computer was installed by the Bureau of the Census…”
The authors see the primary role of computers in business as a way to automate the routine work that could be performed by clerks. Secondly, they state that computers can by used for solving complex math problems “such as those related to launching and tracking earth satellites.”
The report was created for young people who are considering their own choices for education and careers. The authors describe the programming but also various machine support roles. For example, the Coding Clerk’s job is to convert the programmers’ instructions into “machine language”.
The authors recognize that computers will replace some of the traditional clerk roles. “These developments will not only increase the output of clerical workers and slow down growth in clerical employment, but will also change the character of many jobs… Many of the new jobs … will generally pay better and require higher levels of skill and training than most other clerical jobs.” The next sentence is where the authors fail to predict PCs and the internet: “Moreover, a continued increase is expected in the number of officeworkers in jobs not greatly affected by office automation – for example, secretary, stenographer, messenger, receptionist, and others involving contacts with customers and the public.”
The discussion of women in the workplace is clinical in tone. Turnover is high in the clerical fields because many young women stop working when they get married or have children.
There is a special report on “programmers”, one of the newest occupations in the country. Programmers specialize in either of the following: 1) “processing the great masses of data which have to be handled in large business and government offices” 2) “solving scientific and engineering problems”.
The authors describe typical training and career paths. At the time, a college student could not major in computer science. Companies were filling most positions by selecting employees familiar with the subject matter and giving them training in programming. A few colleges purchased computers and provided some training opportunities.
The culture was different back then. “Although many employers recognize the ability of women to do programming, they are reluctant to pay for their training in view of the large proportion of women who stop working…” The authors tip off their female readers that they are more likely to get training in government than industry, if they aspire to be programmers in the 1950’s. Today, the risk and cost of training has largely shifted from the employer to the worker. If you are interested in the topic of bootcamps and STEM pipelines, read the document for their discussion of education.
These authors made a good long-term prediction because they anticipated the business analytics boom. “Continued expansion in employment of programmers is expected over the long run… In offices where the volume of recordkeeping is great, there will continue to be need to reduce the cost of processing tremendous amounts of data and to produce more timely reports on which management decision can be based.” After explaining salary, they talk about perks: “Programmers usually work in well lighted, air-conditioned, modern offices. Employers make special efforts to provide better than average surroundings for programmers, so that they may concentrate to achieve the extreme accuracy necessary for programming.” The nap pods of Silicon Valley have a long history that can be traced back to the Census Bureau.
For nearly 200 million years, reptiles were the dominant animals on land, in the air (e.g. pterodactyls), and in the sea (e.g. mosasaurs). They were efficient herbivores, munching on lush vegetation, and also were efficient carnivores (think: T. rex). They were protected by scaly skin and often horns or armor plates. Mammals at this point were typically small, rat-like creatures, hiding in their burrows from the reptiles, and creeping out at night to feed.
However, the Age of Reptiles came to a sudden end 66 million years ago. Dinosaurs and many other large reptiles disappeared, which gave opportunity for mammals to rapidly evolve and proliferate to fill many key ecological niches. What happened to all those reptiles? The leading hypothesis is that a huge meteorite impacted the earth near what is now the Yucatan peninsula of Mexico. The dust and aerosol cloud that was thrown into the atmosphere darkened the skies around the world enough to shut down photosynthesis long enough to starve the reptilian herbivores, which in turn starved the reptilian carnivores. Somehow enough mammals survived the event to repopulate the earth (my guess is they ate insects which ate dead dinosaurs).
The impact blasted tons of molten rock droplets high in the air, which then fell as little glassy spheres or dust particles all over the world, and especially in North America. Where these “tektites” fell in undisturbed places like bogs, they accumulated as a distinct layer. Over time, these spheres decomposed into a clay layer which is distinguished by a high iridium content. Here is a cut-out section of rock which shows this meteorite-derived boundary layer between lower (older) rocks that contain dinosaurs and an overlying layer where dinosaurs are absent:
Rock section showing layers from the Cretaceous Period (when dinosaurs lived), overlaid by boundary layer material from the asteroid strike 66 million years ago, and then younger Paleogene rocks (no dinosaurs). Source: Phil Manning/Uni of Manchester, UK.
Exactly When and How Did the Dinosaurs Perish?
The picture is complicated by the fact that very few dinosaur fossils have been found in roughly three meters (ten feet) of sedimentary rocks immediately below the Ir-rich meteorite layer. This is known as the “three-meter problem”, and suggests that the dinosaurs had already largely died out from other causes; maybe the meteorite impact just finished them off. Shortly before the impact event, there was a massive series of volcanic eruptions in the Deccan Traps area of India which released enormous amounts of sulfur dioxide and other gasses in the atmosphere, which probably altered the climate. It has been proposed that this fatally stressed the dinosaur populations.
Recent finds from the “Tanis” fossil site in North Dakota have brought clarity to this question. Apparently when the meteorite hit in what is now Mexico, it created a forceful earthquake. When this tremor rolled up to North Dakota, it caused several large waves of water to surge upstream in a creek near the sea, which deposited layers of muddy clay on preexisting sandbars. This occurred several hours after the impact. Providentially, that was just when some of the small glassy spheres which were blasted into the atmosphere were raining down on North Dakota. Some of these spheres, and even their little impact depressions from smacking into the mud at terminal velocity, have been found in the layers of sediment deposited on the sandbars. So we know that whatever fossil remains we find in these sediments were entombed there on the very day the meteorite hit.
It turns out that numerous fossils of dinosaurs have been found in these Tanis mud layers, indicating that there was a thriving community of huge reptiles right up until the impact. These finds include a dinosaur hip/leg with exquisite details of skin preserved, and an egg with a partly-developed pterosaur embryo visible in it:
Ornithischian dinosaur hip/leg/skin from Tanis site. Source: BBC
Fossilized egg with bones of pterosaur embryo in it. Source: Yahoo
Also, immediately below the mud deposit layer have been found numerous dinosaur footprints, indicating the juvenile and adult dinosaurs from a variety of species were tramping around shortly before the impact event:
Source: Riley Wehr et al. paper at 2021 GSA Conference
Bottom line: it looks like we humans do owe our existence in large part to this one, seemingly random meteorite impact which cleaned out the dominant reptiles and made room for mammals.
It has been all over the financial news that Elon Musk made an offer last week to buy out Twitter for $54.20 per share, which is well above its recent stock price. And also, that the board quickly stiff-armed Musk by adopting a “poison pill” provision. What are poison pills, are they a good thing, and how does this particular one work?
Major decisions for a corporation are made by its board of directors. In theory, they are supposed to direct operations for the benefit of the company’s shareholders, who are considered the actual owners of the corporation. The members of the board are elected by the shareholders in annual meetings.
In practice, the board largely does what it wants, and has an outsized influence on who gets elected. The board sets the agenda of the annual meetings, and proposes successor directors. In theory, shareholders can propose resolutions and alternative board candidates at an annual meeting, but it usually takes a determined effort by some activist shareholder group to actually push through some measure that is not approved by the existing board. The outside board members are often executives of other companies, and so are naturally attuned to the interests of the managerial class. Thus, the members of this Old Boys (and Girls) Club tend to vote each other generous pay: board members are typically paid very handsomely for what is often a fairly undemanding, part-time job.
Big corporate mergers and takeovers became a thing in the 1980’s. Some outside investor would make an offer to buy up company shares for more than the current market price. Often, management would resist this offer, since it might entail them losing their cushy jobs. The delicate matter for management in such cases was to convince shareholders that rejecting the buyout offer was in their best long-term interest.
As in so many matters, “where you stand depends on where you sit.” Management would argue that “short-termism” is bad for the company and for the nation as a whole; the “corporate raiders” would just fire people, break up the company, and sell off the pieces, and generally create misery. The outside investors would reply that their new management would “unlock value” better than the current management was doing, by making operations more efficient and competitive and innovative.
A variety of measures might be implemented by the board to make it less attractive or less feasible for a change in control. The terms of the board of directors might be staggered, so that it would be impossible for the existing board to be totally changed out in less than say 3 years, even if someone controlled 100% of the shares. A company I was associated with in the 1990’s implemented a policy that provided for generous severance packages for upper employees in the event of change of control. (Again, management looking out for themselves).
The term “poison pill” typically refers to some measure that targets share prices, in a way to discourage a hostile takeover. The most common form is the “flip-in” approach:
A flip-in poison pill strategy involves allowing the shareholders, except for the acquirer, to purchase additional shares at a discount. Though purchasing additional shares provides shareholders with instantaneous profits, the practice dilutes the value of the limited number of shares already purchased by the acquiring company. This right to purchase is given to the shareholders before the takeover is finalized and is often triggered when the acquirer amasses a certain threshold percentage of shares of the target company.
This is what the Twitter board has pulled on Musk. If he acquires more than 15% of Twitter shares without board approval, the company will allow any shareholder (except Musk) to purchase additional shares at a 50% discount. Yes, this dilution would tend to lower the value of the shares, but if a lot of shareholders bought into this offer, his share of control would shrink. If he tried to buy yet more shares to get back to more than 15% ownership, the company would issue yet more discounted shares to everyone except him.
Is the Twitter board acting in their own interests, or the interests of the shareholders? Investment adviser Larry Black noted, “Let me point out something obvious: If Elon Musk takes Twitter private, the Twitter board members don’t have jobs any more, which pays them $250K-$300K per year for what is a nice part-time job. That could explain a lot.”
Musk hinted at a “Plan B”, and tweeted provocatively, “Love Me Tender”. He might be considering trying to bypass the board altogether and make a “tender offer” to the shareholders at large to sell their shares to him, at some attractive price. Typical conditions for such an offer would be that he only has to make good on his purchase offer if some large plurality of the shareholders take him up on it. It turns out that in practice this approach can be messy and complicated and delayed, probably not something the fast-moving Musk might have patience with. Also, even if he captured 100% of the shares, he could not replace all the existing board members for something like three years, so they could remain sitting there, making anti-Musk decisions all along.
Musk’s offer has now put Twitter “in play” as a takeover target. You know that lots of wealthy people and entities are consulting their investment bankers about becoming a white (or black) knight here. Anyway, it makes for great theater. Popcorn, anyone?
This is from The Price of Peace by Zachary Carter. What strikes me is the fact that a fleeing refugee doctor enabled Keynes to join the fight, again at the age of 58.
The following passage starts on page 316: “In the meantime, Keynes was at last in good health again. He owed his new energy in part to Hitler’s aggression. In 1939, Keynes had hired János Plesch, a Hungarian Jewish doctor who had relocated to London after fleeing Nazi persecution.
[Plesch resolved Keynes persistent throat infections by administering one of the earliest antibiotics (that was developed in German labs by Bayer before the war!).]
“After two decades of depression, however, the British economy was entering the fight of its life in ragged condition. … On the eve of war, worker productivity was 125 percent higher in the United States than it was in Britain.
“In the meantime, Germany had shifted its offensive focus to London. The Blitz…
“British diplomats didn’t have time to waste. After trying everything else, they brought in Keynes.”
“So Keynes went to Washington in May 1941 to negotiate more practical terms of cooperation and promptly infuriated nearly everyone he met.”
My thoughts: Money wins wars. Wars redistribute talent. Talent makes money. Is the cycle still going? Is this a post-industrialization phenomenon only? Will Tyler’s upcoming book on talent shed any light on this topic?
Podcast with Anne Applebaum on dictators (May overlap considerably with your Twitter stream of info, but at least you could walk while learning and take a scrolling break.)
The implication here is that many of the social beliefs we hold today are very different from what people held 50 years ago, and (possibly, therefore) it’s not radical to still hold those beliefs today. The Tweet above doesn’t specify exactly what those beliefs are, but we can use survey data to dig into what those might be. Thankfully, one of the greatest social surveys out there was first conducted in 1972, exactly 50 years ago: the General Social Survey.
What exactly did a normal person believe around 1972, according to the GSS?
Some eighteen months ago, I wrote here on “Money as a Social Construct“. Most civilizations over the millennia have found it expeditious to move from simple, immediate barter of physical objects like cows to some system involving “money”. But what is money? Wikipedia gives the following standard definition:
Money is any object or record that is generally accepted as payment for goods and services and repayment of debts in a given socio-economic context or country. The main functions of money are distinguished as: a medium of exchange; a unit of account; a store of value.
For convenience, the “thing” used as money is best if it is portable and durable and of limited amount. Gold and silver have historically served these purposes. Even though these are physical objects, their actual value in usage (e.g. how much gold does it take to buy a cow) is arbitrary. Its value in usage is whatever is agreed upon by the users.
For this system of money to work, the key players all have to believe in the value of the gold coins. Thus, money is a mainly social construct, an article of mutual faith. If people lose faith in the value of some form of non-commodity money, it will in fact become valueless.
We have moved from useful commodities like cows, to gold coins and bars, to printed dollar bills redeemable in gold, and now to fiat currencies not formally tied to any physical objects. And in the twenty-first century, most “money” is not even tangible printed bills, but is in the form of digital entries in accounts “somewhere”.
Trillions of dollars’ worth of transactions take place every year, on the supposition that the dollar you deposit in a major bank will be there next week or next year. At my own personal level, nearly all of my life savings exists in the form of investments in stocks or bonds of corporate entities, which are held in accounts that I only ever access from my computer. Thus, I rely on on-going functional, reasonably honest government to enforce rules on the stewardship of those funds at multiple levels. So I am betting everything on the supposition that law and order prevail.
Well, in war sometimes “law and order” do break down and the normal rules of stewardship are over-ridden. Such has been the case with Russian foreign reserves. The central banks of major nations hold assets in the form of accounts at other central banks. Russia, as a big net exporter, has accumulated reserves of dollars and other currencies at the central banks of various nations in the West. In the wake of Russia’s invasion of Ukraine, the Western banks froze some 630 million of Russian assets held in these banks. There has even been discussion of redeploying these assets to pay for assistance to Ukraine.
(Sadly, as I noted in How Overzealous Green Policies Force Europe to Bankroll Putin’s Military, these seemingly dramatic fund seizures and SWIFT sanctions are annoying but not crippling for Russia. Europe is still funneling billions of euros a month to Russia, because Europe has made itself utterly dependent on Russian natural gas due to prematurely chopping its own nuclear and coal power generation and banning the fracking process that has unlocked such enormous oil and gas production in the U.S.)
It is understandable why the West has taken such a step, in view of the unjustified Russian attack on Ukraine, and the ongoing atrocities such as the bombing of a maternity hospital and a clearly-marked children’s shelter. However, this action may lead to worldwide reappraisals of what is money and how net export nations choose to store their monetary surpluses.
The Wall Street Journal ran a piece called, “If Russian Currency Reserves Aren’t Really Money, the World Is in For a Shock.” It is suggested that central banks may be motivated to accumulate more of their reserves in the form of physical gold, held in their own countries, which cannot be confiscated by some outside forces. Or we may even go back to using “cows” as a store of value, with central banks gaining title to piles of useful commodities such as wheat or nickel or palladium.
Good hockey players skate to where the puck is heading. I bought into a fund of corn futures yesterday. After posting this article, I think I will log into my brokerage account and buy some shares in a fund holding physical gold.
The financial crisis recession that started in late 2007 was very different from the 2020 pandemic recession. Even now, 15 years later, we don’t all agree on the causes of the 2007 recession. Maybe it was due to the housing crisis, maybe due to the policy of allowing NGDP to fall, or maybe due to financial contagion. I watched Vernon Smith give a lecture in 2012 in which he explained that it was a housing crisis. Scott Sumner believes that a housing sectoral decline would have occurred, and that the economy-wide deep recession and subsequent slow recovery was caused by poor monetary policy.
Everyone agrees, however, that the 2007 recession was fundamentally different from the 2020 recession. The latter, many believe, reflected a supply shock or a technology shock. Performing social activities, including work, in close proximity to others became much less safe. As a result, we traded off productivity for safety.
The policy responses to each of the two were also different. In 2020, monetary policy was far more targeted in its interventions and the fiscal stimulus was much bigger. I’ll save the policy response differences for another post. In this post, I want to display a few graphs that broadly reflect the speed and magnitude of the recoveries. Because the recessions had different causes, I use broad measures that are applicable to both.
This semester I am participating in a reading group with undergraduate students that focuses on the history and prospects for capitalism and socialism. Lately we have been reading Joseph Stiglitz, who has long argued that China’s transition to a market economy has gone much better than the former Soviet Union. Gradual transition is superior to “shock therapy,” according to Stiglitz.
There’s an extent to which this is true. If we just look at economic growth rates since, say, 1995, China has clearly outpaced Russia.
It’s hard to know exactly what year to start, since GDP figures for former planned economies immediately after transition aren’t reliable, but the start date is mostly irrelevant for everything I’ll say here (please play around with the start year in the charts to see if I’m cherry-picking years). 1995 seems a reasonable enough year to start for reliable post-transition starting point.
As we see above, while Russia has had a rough doubling of GDP per capita since 1995 (respectable, and yes, it’s all adjusted for inflation!), China has soared almost 600%. Wow! But this is something of a cheat. Despite all that growth, average income in China is still lower than Russia: only about 60% of Russia in 2020. China started from a much lower level, meaning that faster growth, while not guaranteed, is at least easier to achieve. In fact, if we go back to 1978, when China’s first reforms began, GDP per capita in the Former USSR was about 6 times as high as China (that’s according to the latest Maddison Project estimates, which will always be speculative for non-market economies, but are the best we have).
Furthermore, Russia hasn’t really transitioned to a democracy either. China clearly hasn’t, but no one doubts that. But despite having the outward symbols of democracy (elections, a legislature, etc.), Russia still scores low on most indexes of democracy and civil liberties. For example, Freedom House scores them at 19/100, a little better than China (9/100), but nothing like Western Europe.
So, did the quick transition to market economies fail? Not so fast. While it did fail in Russia, in most of Eastern Europe and the eastern part of the former USSR seems to have been a major success. Take a look at this chart, which shows the former Soviet Republics in and near Europe (I exclude Central Asian FSRs).