Whether one might socially offend us or whether one commits a crime, we face a fundamental tension between punishment and forgiveness. Punishment is important because it acts as a deterrent to the initial offense or to subsequent offenses. But punishment is also costly. Severing social or commercial ties reduces the number of possible mutually beneficial transactions. We lose economies of scale and lose gains from trade when we exclude someone from the market. Forgiveness is important because it permits those who previously had conflict to acknowledge the sunk cost of the offense and proceed with future opportunities for trade. However, an excess of forgiveness risks failure to deter destructive behaviors.
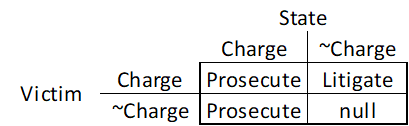
In the US, we enjoy a state that can prosecute alleged offenders and enforce punishments regardless of the economic status of the offended. While not perfect, the state incurs great cost by being the advocate of those who could not enforce great retributive punishment by their own means. A victim may choose to press charges against an offender, or the state can press charges despite a permissive victim.
In fact, our system of prosecution is somewhat asymmetrical. The state can press charges against a suspect, regardless of the victim’s wishes. While a victim can’t compel an unwilling state to press charges, say if the evidence is scant, an individual can engage in litigation against the accused.
Most of the possible combinations of victim and state strategies result in some kind of prosecution of the alleged offender. Except for litigation, our punishments in the US tend not to be remunerative – the victim isn’t compensated for the evils of the offender. ‘Justice’ is often construed as a type of compensation, however.
I was pleased to see yesterday the announcement of a new journal, the Journal of Comments and Replications in Economics. As the name implies, it will publish articles that comment on or attempt to replicate previously published economics papers.
While empirical economics papers have in some ways become more believable over time, it is still rare for anyone to verify whether the results can actually be replicated, and formal comments on potential problems in published papers have actually become less common over time (though Econ Journal Watch has been a good outlet for comments).
The ability to independently verify and replicate findings should be at the core of science. But economists, like most other disciplines, are generally too focused on publishing original work to test whether already-published papers hold up. When we do try to replicate existing work, the results aren’t very encouraging; at best 80% of economics papers replicate.
If we want people to trust and rely on our work, we need to do better than that. The US Department of Defense agrees, and funded a huge project to determine what types of social science research hold up to scrutiny. I’ve been a bit involved in this and hope to sum up some of the results once this semester is over. For now, I’ll just say I’m happy to see the new Journal of Comments and Replications in Economics (and that it is both free and open-access, a rare combo) and I hope this represents one more small step towards economics being a real science.
It’s pumpkin spice season. That means that not only can you get pumpkin spice lattes, but also pumpkin spice Oreos, pumpkin spice Cheerios, and even pumpkin spice oil changes.
The most important thing to know about “pumpkin spice” things is that they don’t actually taste like pumpkin. They taste like the spices that you use to flavor pumpkin pie. (Notable exception: Peter Suderman’s excellent pumpkin spice cocktail syrup, which does contain pumpkin puree.)
Last week economic historian Anton Howes posted a picture of the spice shelf at his grocery store and guessed that this would have been worth millions of dollars in 1600.
Just thinking about how much this shelf would have been worth in England in the year 1600. Presumably at least tens of millions in today’s money. pic.twitter.com/Vc9HDBlQxL
Some of the comments pushed back a little. OK, probably not millions but certainly a lot. Howes was alluding to the well-known fact that spices used to be expensive. Very expensive. Spices, along with precious metals, were one of the primary reasons for the global exploration, trade, and colonialism for centuries. Finding and controlling spices was a huge source of wealth.
But how much more expensive were spices in the past? One comment on Howes’ tweet points to an excellent essay by the late economic historian John Munro on the history of spices. And importantly, Munro gives us a nice comparison of the prices of spices in 15th century Europe, including a comparison to typical wages.
As I looked at the list of spices in Munro’s essay, I noticed: these are the pumpkin spices! Cloves, cinnamon, ginger, and mace (from the nutmeg seed, though not exactly the same as nutmeg). He’s even included sugar. That’s all we need to make a pumpkin spice syrup!
Last week in my Thanksgiving prices post I cautioned against looking at any one price or set of prices in isolation. You can’t tell a lot about standards of living by looking at just a few prices, you need to look at all prices. So let me just reiterate here that the following comparison is not a broad claim about living standards, just a fun exercise.
That being said, let’s see how much the prices of spices have fallen.
The U.S. “stock market” is represented by various collections of stocks, such as the Dow Jones Industrial Average (30 stocks), the NASDAQ Composite (securities listed on the NASDAQ; weighted towards information technology), and the Standard and Poor’s 500 Index. The S&P 500 is an index of the largest 500 companies listed on the New York Stock Exchange and the NASDAQ, weighted by capitalization. The version of the S&P usually cited just takes into account stock prices. History shows that, over a reasonably long-time frame, the U.S. stock market rises. Here is a chart, using a logarithmic axis, of the S&P from January, 1950 to February, 2016. It shows a rise in value by a factor of about 65 between 1950 and 2016.
Below is a chart of S&P values from 1980 to 2021 on a linear scale, which compresses the earlier data and magnifies more recent variations. This shows the Covid-related dip in early 2020, which was followed by a meteoric rise as Fed and federal money flooded the financial system:
Source: Yahoo Finance
A lab technician I knew in my company in the 1990s took every bit of savings he had (about $50,000) and plowed it all into the stock of America Online (AOL). This was when the internet was just taking off, and AOL was a leading company in that field. My friend held on while his investment doubled, then had the conviction to hang on until it doubled again. He then cashed out with around $200,000, quit his job, got an MBA in finance, and ended up managing money on Wall Street.
With these sorts of success stories, and the (so far) reliable performance of the stock market, how hard can it be for the average small investor to pick a winning basket of stocks? Surprisingly hard, it turns out.
A study of the returns of U.S. stocks from 1926 to 2015 was published by Hendrik Bessembinder, a business professor at Arizona State University. A draft copy is here . He worked with total returns (stock price plus dividends). He found that the rise of the S&P is entirely due to huge gains by a tiny subset of stocks. The average stock actually loses money over both short and long time periods. In statistical terms, this is an extremely skewed data set; the mean return is greater than the median. There is a sort of Darwinian selection that occurs in a market index like the S&P 500. The companies that are doing well tend to get more represented in the index as their stock prices rises relative to other companies, while the relative weighting of losers automatically diminishes.
This asymmetry between winners and losers is partly a result of the following math: If you invest $1000 in a company that then tanks, the most you can lose is $1000. But if that company is one of the rare firms that really takes off, you could make many times your initial investment. If you had put $1000 into Microsoft (MSFT) in 1986, your shares would now be worth nearly five million dollars.
According to Bessembinder’s study, half of the U.S. stock market wealth creation had come from a mere 0.33% of the listed companies. The top five companies (ExxonMobil, Apple, GE, Microsoft, and IBM, at that point) accounted for a full 10% of the market gain. Each of these companies had created half a trillion dollars or more for their shareholders. ( A similar list of the top five or ten value-creating companies drawn up in 2021 would have a different set of names, obviously, but a similar principal has held in recent years – a huge portion of the rise in “stocks” in the past five years has been due to a handful of internet superstars, the FAANGM stocks).
Out of some 26,000 listed companies, 86 of them (0.33%) provided 50% of the aggregate wealth creation, and the top 983 companies (4%) accounted for the full 100%. That means the other 25,000 companies netted out to zero return. Some gave positive returns, while most were net losers.
The average stock which you might pick by throwing darts at the Wall Street Journal listings lost money 52% of the time in any given month, and 51% of the time over the life of the company. The lifetime of the average company was only seven years, with only 10% of companies lasting more than 27 years.
This helps explain why actively managed stock funds, where diligent experts analyze and select some subset of stocks in an attempt to beat the market, typically underperform the broad market indices. (The fees charged by these funds also drags down their performance relative to the market indices). This also explains why about half the small-cap stocks I have bought over the years in my little recreational brokerage account have lost money. I had thought I was particularly inept at stock-picking. Turns out I was just about average.
There are lots of big questions about welfare programs and how to design them. I am not going to answer any of those questions here, but I am going to ask a few, specifically these two:
Should receipt of welfare be means-tested for need (e.g. TANF) or universal (i.e. a minimum income for everyone)?
Should receipt of welfare be conditional on employment?
The good arguments for means-testing usually boil down to maximizing impact. If we have a fixed amount of resources we can redistribute, then we can maximize the impact of those resources by directing them towards the people with the greatest need (rather than spreading it thinner across everyone). The good arguments against means-testing revolve around changing incentives at the margin. Even when designed with gradual phasing out as a person’s income rises, there remains the unavoidable reality that means-tested welfare reduces the value of every marginal dollar earned within the phase-out window.
The good arguments for requiring employment to receive a form of welfare are, again, incentives to work, this time at the extensive margin (i.e. how many people in the population choose to work at all). The good arguments against requiring employment are the obstacles that poverty places between people and finding work. It becomes a classic Catch-22 – you’re poor because you can’t find work, but you can’t find work because you are poor. Welfare unconditional of employment can help people get over the hump and into their next job.
None of these observations are new, and these very much remain hard questions. Yes, we should be concerned with incentives to work at the margin, but the fact remains resources are finite, and many people will, at some point in their lives, need a lot of help. The more we can give them the better. This pushes me towards means-testing. But then I remember that those marginal incentives to work at the intensive margin (how much to work) depend on phasing out of benefits with increasing visible income. For people living in poverty, there exist a number of viable earning options that are not visible to the institutions testing their means. A dollar earned in legal wages might reduce TANF benefits by $0.15, but a dollar earned in the black/gray market leaves those benefits untouched. Yes, illegal earnings come with risks, including future access to benefits, but the possibility remains that means-testing benefits could have the perverse effect of increasing the relative value of any and all “off-the-books” income, be it cash labor in the gray market or explicit criminal earnings.
Considering whether a source of welfare should be conditional on employment raises the question of wage subsidies versus cash welfare, but it’s really just the same question we were pondering previously, but with greater emphasis on incentives to work or not. These questions at the extensive margin, much like those at the intensive margin, become far more interesting when placed in the context of not just whether to workor not, but which market to work in. In a world of prohibitions scattered across a variety of extremely high demand (and high profit) markets, where licensing, educational norms, and discrimination all work to create a collage of cash opportunities outside of the well-lit protections of legal labor markets, there is no shortage of work that goes unseen. Welfare transfers conditional on legal labor can serve as incentive to pull people out of these market, and begin building a record of accomplishment that serve them going forward. This speaks in favor of conditioning welfare on employment, so long as everyone has access to employment.
This this thought experiment leaves me mostly where I started (no surprise, an hour’s reflection rarely changes my priors), namely that wage subsidies have a place in our welfare system, as does means-testing, but as welfare benefits rise, they should become more universal in their access across the income distribution, a lesson I expect we will learn in retrospect as we come out of “The Great Resignation”. A “universal basic income” need not be fully universal, but there are good reasons for it to reach well passed the median income. Or median voter, for that matter.
That sentence is one that I repeat every time I teach economic history. It is repeated because a common misconception in history is that there are “different mentalities”: a pre-capitalist mentality versus a capitalist mentality; a western mentality versus a non-western one etc. The variations are endless but the common denominator is quite simple: there are discontinuities in economic rationality and these discontinuities explain economic change.
That, as I explain to my students, amounts to labelling people of the past as “irrational morons” who would leave $100 bills on the sidewalk. There are no variations in rationality, merely variations in constraints and incentives. That is what I tell my students. And the thing is, that statement is actually testable! Indeed, arguing that something in people’s brain changed is an argument that can never be tested because they are dead and cannot testify. In fact, even if they were alive, their statements would be meaningless because nothing speaks louder than actions (i.e. preferences are revealed by action). Making statements about the rationality of X or Y action is easily testable as we can observe what people did (or do now). And its really easy to refute differences in “mentalities”
Let me give you an example from my native Canada. In Canada, there is a large French minority (the majority of which lives in Quebec) which has long been argued to hold different economic mentalities than the neighboring English majority. Peddled (yes, that is a strong term but I think it applies) by both French and English historians (and economists), this view is used to explain the relative poverty of the French minority (which has historically been 60%-75% as rich as the English majority). As far back as the early 19th century, French-Canadians are argued to have clung on to archaic farming techniques even though they observed better techniques from their English-speaking neighbors. Their “traditional conservative” outlook (in the words of an eminent Canadian historian) pushed into economic stagnation (and even retrogression by some accounts). This view continues today. I vividly remember a debate on French-Canadian TV with former Quebec premier (like a governor for Americans) Bernard Landry telling me that there was a difference between my “anglo-saxon economic worldview” (i.e. neoclassical economics) and that which most French-Canadians held.
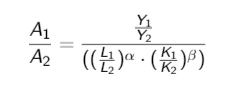
The virtue of this example is French-Canadians are deemed to be of a “lesser” mentality than English-Canadians at the same moment in time. Thus, it is easy to test whether this is the case. In multiple works, notably in this paper atHistorical Methods, I have used simple tools from economic theory to assess this lesser mentalities hypothesis. Start from a simple Cobb-Douglas production function:
Where A is technology residual (also known as total factor productivity or TFP), Y is total output, K is the capital stock and L is the labor supply. The exponents are just the elasticities of capital and labor. If the English and French in Canada are separated, there are two production functions (with one for each) and they can be divided by each other. But the neat part about the Cobb-Douglas function here is that you can rearrange the equation and solve in terms of A rather than Y. As A is total factor productivity, it tells us how effectively people combine inputs K and L to produce Y. And then you can express A in the French sector (1) as a ratio of A in the English sector (2) as in the formulation below
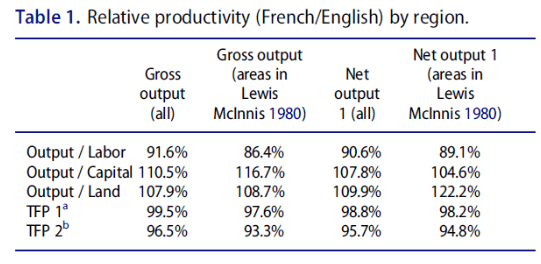
Technically, if the French farmers were less efficient than the English farmers the ratio on the left-hand side should be less than 1 (as A1 < A2 ). Using data from the 1831 census of Lower Canada (as Quebec was known then), I compared farms in French areas to farms in English areas. The results? Yes, the French farmers were poorer (income Y1 < Y2 ) but there were very small differences in efficiency of input use (A) between French and English farmers as can be seen in the table below. French areas were 4.3% to 0.5% less efficient than English areas.
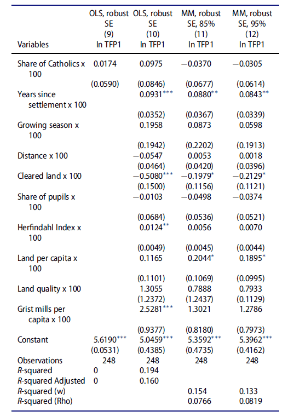
But when you controlled for land quality, distance from urban markets, recency of settlement, complementary industries and other controls, there are no statistically significant effect of culture (proxied in the table below by share of Catholics as all French-Canadians in 1831 were Catholic and very few English-Canadians were Catholic). In other words, the small differences have nothing to do with culture or differences in mentalities.
Notice that this was a relatively simple logical test. The farming actions of French-Canadians were observed in the data. We know which inputs they chose to use (in which quantities as well). The results of these actions are easily observable through the output data in the census. Irrationality on their part is thus easy to test as a simple Cobb-Douglas model suggest that irrationality would be manifest by an inferior ability to use and combine inputs. They used inputs equally well as English Canadians and so that claim of inferior mentalities was wrong.
One could reply that I am just picking an easy case to dismantle the “mentalities” claim. But I am actually late to that party by adding the French-Canadians. Similar claims have been made for Russian, French, Italian, Chinese, Vietnamese, Korean, Mexican, Indian, Polish, New Englanders (yes, you read right), Danish, Irish, Kenyans, Algerians, Egyptians etc. Hundreds of economic historians and economists have shown that these cases do not hold.
If you wish to explain economic change (or economic disparities), you have to look elsewhere than “changes in mentalities” (or differences in mentalities). If you dont, you are essentially claiming that people of the past were irrational morons who simply lacked your expert knowledge.
For some Americans, this Thanksgiving was the first holiday that felt normal in a long time. Being re-united, without Covid restrictions, is something to celebrate.
On the other hand, a new coronavirus variant was just discovered in South Africa. It’s scary enough that travel bans might be imposed. We have all (just about) learned to live with the original strain from Wuhan, but scientists want time to figure out how dangerous and infectious this new strain is. Maybe at this point people are tired of being lectured about risks. No matter how much or little a person sacrificed for Covid-19, they might feel like that storyline has become too boring to deserve any more of our attention. We cannot stop looking out for new variants that might force us to put cherished traditions on hold again. Coronaviruses kill. My advice is to keep following news from Tyler Cowen, Alex Tabarrok, and Emily Oster.
Oster has been consistently reasonable about family and health risks. She argued to open schools and essentially said that you can see grandparents if the risk is small enough (even though the risks are never zero). As I said before, another trustworthy source of information throughout the pandemic has been Tyler and Alex, who put up almost all of their material in real time at Marginal Revolution.
I’ll share something a friend wrote to me today:
Although [his wife’s name]’s chemo treatment continues to show good long-term signs, this morning we discovered that [she] tested positive for COVID. That’s bad news, the good news is that [she] is already getting the antibody treatment and some extra fluids at the hospital as I write this.
“The antibody treatment” did not exist when the first Covid-19 waves swept through New York with such devastating consequences.
If the newest strain turns out to be a serious development, then in many ways we are better prepared to deal with it than we were before. We probably will blow through the red tape on at-home rapid tests faster the next time around (I’m such an optimist!). We already have contact tracing apps that protect privacy. Vaccine scheduling software is already in place. Everyone has masks at home.
The biggest difficulty I foresee is not coming up with scientific solutions but agreeing as a society about which tools to use. Some people might (will) not even believe the new strain is real.
EWED was started right at the moment when Marginal Revolution commentary on Covid seemed the most crucial. So, sometimes I will do little more here than keep up the echo. Do tweets, phone calls, letters, blogs, or talk about Covid around the Thanksgiving table. Don’t give up.
It’s now clear, whether or not the news out of South Africa turns out to be serious, that we are living with a new problem that will last a long time. It’s a marathon, not a sprint.
If you ever read much of the New Testament, you’ll see a theme in the letters of Paul to cities he has visited. The brand-new churches were doing well, while he was with them in person. Then time goes by and the community or doctrine starts to fray.
Paul wrote these words to the church in Galatia, more than a year after he had visited them:
Let us not become weary in doing good, for at the proper time we will reap a harvest if we do not give up.
In grad school, I learned about the overlapping-generations model. The idea is that we simplify people down to the fundamental parts of their life-cycle. Each person lives for 2 periods. In the first period, they can produce only. In the second period, they can consume only. A popular conclusion of the model pertains to old-age benefit programs such as Social Security.
The first beneficiaries receive a gift that is free to them, then each subsequent generation accepts the debt, pays it off, and then passes on new debt to the proceeding generation. In this manner, the program benefit of the current generation is limited by the income of the following generation. Therefore, every single generation can consume as if they lived a generation later – and a generation richer – in time. That’s exciting.
But this model is not unique to governments. With a little bit of finance, we can model every person as their own self-encapsulated overlapping-generations model – with two similarly exciting conclusions. Let’s consider a person who has monthly consumption expenditures of $1k per month and let’s assume a discount rate of half a percent per month.
Life is pretty good for this person. They earn income each month and they spend $1k of it during the same period. Now let’s give the person a credit card. It doesn’t matter what the interest rate is – they’re going to pay it off each subsequent month. Now let’s see what’s possible.
What’s going on here? The difference in the consumption pattern is that the first month with a credit card can enjoy twice the consumption. How’s that? $1k of that January consumption is just the typical monthly spending. The other $1k is running up a month’s worth of spending on the credit card. So long one pays-off the card in the following month, there are no interest charges. But wait – if one pays-off the credit card in February, then how does one consume in February? By borrowing from March’s income, of course! And so the pattern repeats ad-infinitum. With a credit card one can borrow against next month’s spending. You too can borrow from your future self. And your future self won’t mind because they’ll do the same thing.
Conclusion #1: Having a credit card entitles you to one free month of double consumption.
The above example includes identical income over time. But, what if your income grows? Let’s assume that your income and commensurate consumption grow at a rate of one quarter percent per month. Our consumption without a credit card is tabulated below.
Obviously, having income and consumption that grow is more enjoyable than ones that are constant each period. Now let’s observe below what happens when we again introduce a credit card that one pays-off each month.
What’s going on here? Just as happened previously with a credit card, one can enjoy an extra boost to consumption in the first period. But what does growing income do for us besides greater complication? Just as previously, one can pay their debt each period and consume by borrowing against the next month’s income. But with growing income, having a credit card means that one can enjoy the next month’s level of consumption today. That is, next month’s higher consumption is shifted sooner in time by one month. Notice that, with growing income, consumption for July without a credit card ($1,018) is the same as the consumption in June with a credit card. Even without the first-month-gift, credit cards increase the present value of one’s consumption by making next month’s greater income available today – and the same is true for every single month.
Conclusion #2: Having a credit card today entitles you to next month’s greater income.
How big a deal is this? Obviously, it will differ with the discount rate and the rate of income growth. Using the numbers above, having a credit card permits one to consume with a present value that is 10.5% higher. Let that sink in. People who have access to credit consume as if they are 10.5% percent richer. Access to credit can make the difference between a pleasant Christmas, having quality internet, paying for car repairs, and so on. Being poorer is one thing. Being poorer and lacking access to credit is like taking an instant haircut to one’s quality of life. On the flip side, people can be made better-off without additional improvements to their productivity. Increasing access to credit may be a less costly improvement to the value lifetime consumption than many of the other less politically feasible improvements to labor productivity.
In 1621 the pilgrims were starving after their communal farming system gave them little incentive to work hard, leading them to rely on the generosity of their native neighbors at the first Thanksgiving. But in the long run they were able to produce their own feasts after switching to a private property system. Economist Ben Powell tells the story briefly here, or you can read the primary source, William Bradford’s Diary here.
It is customary in many families to “give thanks to the hands that prepared this feast” during the Thanksgiving dinner blessing. Perhaps we should also be thankful for the millions of other hands that helped get the dinner to the table: the grocer who sold us the turkey, the truck driver who delivered it to the store, and the farmer who raised it all contributed to our Thanksgiving dinner because our economic system rewards them
Powell calls this “the real lesson of Thanksgiving”, and while I think there are other great angles to the story this is certainly a real lesson of Thanksgiving.
But is it true? In short: no. I’ll explain why, but my larger goal is to get you to think more clearly about inflation.
How should we measure the cost of a Thanksgiving meal? A widely used measure comes from the Farm Bureau, which shows that the cost of a traditional turkey-centric meal costs about 14% more than last year. In dollar terms it is $53.31 for a turkey, a pumpkin, cranberries, sweet potatoes, stuffing, etc. That’s more that it has ever been, in dollar terms. Farm Bureau has been tracking the cost of this same meal since 1986.
So in one sense, it seems like the headline claim is true. Most expensive Thanksgiving ever!
But we need to think deeper. A nominal price doesn’t actually tell us much. If a long-lost cousin from the Republic of Horpedahl told you it costs 1 million Jeremys to buy a Thanksgiving dinner, what would your reaction be? The first and best reaction is: how much do people earn in the Republic of Horpedahl?
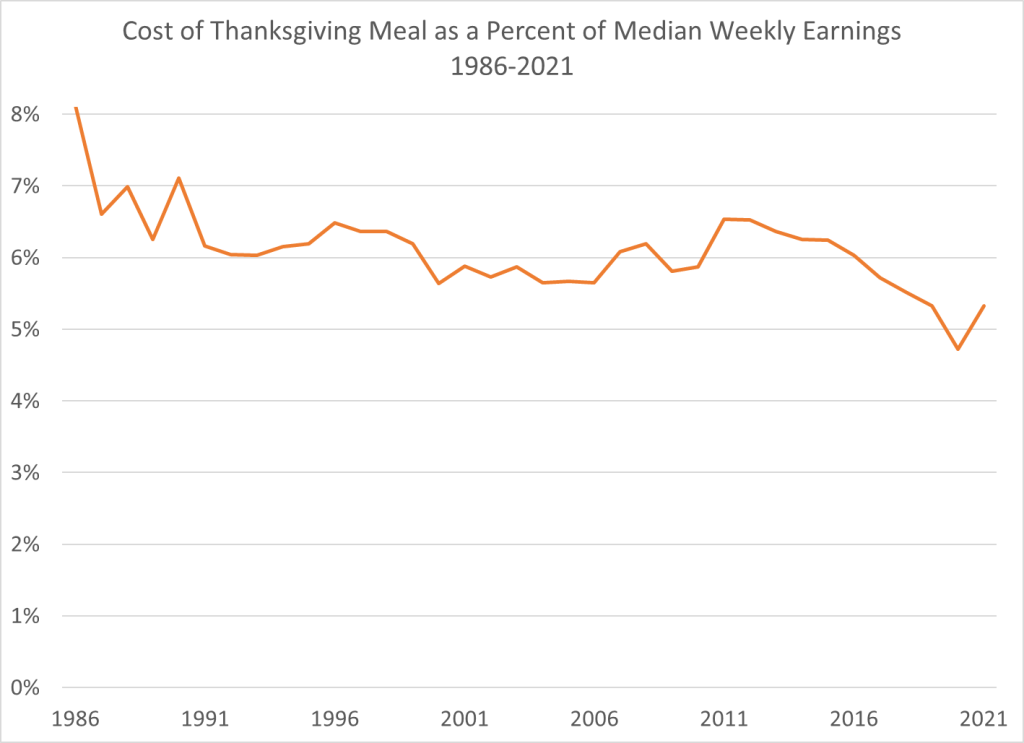
We should ask the same question in the United States today: how do incomes today compare to incomes in the past? Which measure of income you use is important, but if we use median usual weekly earnings of full-time workers, we can make a simple comparison of how much of your weekly earnings would be needed to buy a traditional Thanksgiving meal. This chart shows exactly that. In 2021 that meal will be the second lowest it has ever been as a percent of median earnings — higher than last year, but tied with 2019 for the second lowest. And much less than in the late 1980s and early 1990s (I use third quarter data for each year, the most recent available).
Adjusting for income is the best way to look at this question. It’s not perfect — part of this depends on what income measure you use — but it’s much better than the alternative. The worst approach is to just look at nominal prices. This tells you virtually nothing.