Not so Great Expectations

People have expectations about the world. When those expectations are violated, they usually change their behavior in order to account for the new information (on the margin at least). Does unexpected inflation affect people’s behavior? Of course. William Phillips thought so (the famous version of the Phillips Curve assumes constant inflation expectations).

Macroeconomists often separate the world into reals and nominals. Sometimes we produce more and other times we produce less. Those are the reals. The prices that we pay and the money that we spend are the nominals. There is what’s sometimes called a ‘loose joint’ between reals and nominals. That is, they do not move in tandem, nor are they entirely independent. If the Fed suddenly slows the growth of the money supply, then economic activity growth might also slow – but not by the same amount. In the long run, reals and nominals are largely independent. Whether we have 2% vs 3% annual inflation over the course of some decade is probably not important for our real output at the end of that decade.

It Takes Two to Tango.

It is often said that the Fed can achieve any amount of total spending in the economy that it prefers. It can achieve any NGDP. But, the Fed doesn’t control NGDP as a matter of fiat. The Fed changes interest rates and the money supply in order to change the total spending in our economy. Importantly, the effect of Fed policy changes is contingent on how the public reacts. After all, the Fed can increase the money supply. But it is us who decides how much to spend.

Continue reading →

Post Pandemic Vacation Arbitrage

My wife traveled to Ireland with a friend after she graduated with her bachelor’s degree. She had lived in Europe as a child and had travelled for mission trips. But travelling to the Irish Republic as a young adult, for the singular purpose of celebration and leisure, made a big impact on my eventual wife and she recounted it for years.

Remember pre-Covid when life was so easy? Many of us had planned trips, for business and leisure, that were interrupted. By now, the vast majority of people are back to ‘normal’ (I think?). Classes are in-person, masks are largely optional, and there is no more line stretching out down the sidewalk near the Trader Joe’s. With all this normalcy, one might ask:

Where’s your next vacation?

Continue reading →

The Economics of Good Gift Giving

This post was co-authored with a recent AMU Economics Graduate, Michael Maynard (Linkedin here). It is based on his senior thesis entitled “The Highest Virtue: Re-examining gift Giving and Deadweight Loss”

When my older sister was in middle school, she received a book of baby animal stories. She loved that book and read it every day. A couple of years later my mother accidentally donated it, and my sister was heartbroken. We went to the thrift store repeatedly that week hoping to encounter it before it sold, but we never found it. Years later, our father scoured the internet trying to find the lost book – to no avail.

Years after that, I stumbled onto the exact same copy of the book in the for-sale corner of a nearby library. For a single dollar and negligible effort, I purchased the book that had long frustrated my family’s searching. Shortly before the birth of her first child, I gave the book to my sister for Christmas. It was one of the best Christmas gifts she had ever received.

Economic theory typically assumes that individuals have perfect information. Therefore, they are best suited to purchase their own gifts. That’s what motivates the not-so-romantic economist prescription to give a gift card or cash for birthdays, Christmas, graduations, etc. The theory states that, if we do not intimately know the receiver’s preferences, then we have incomplete information and it’s better to give a money-gift rather than to give a gift from which the receiver would enjoy less additional utility.

Continue reading →

Human Capital is Socially Contingent

The Deaf community is interesting.

Before I did research, I thought that deaf people simply could not hear. After seeing the Spiderman episodes that featured Daredevil, I believed that it was plausible and likely that deaf people had some sort of cognitive or sensory compensatory skill.

But it wasn’t until recently that I learned of the Deaf Studies field. There is an entire field that’s dedicated to studying deaf people. It’s related to, but not the same as Disability Studies. In fact, there are some sharp divisions between the two fields.

Continue reading →

Children Are Not 3/55ths of a Person

In the past several years there has been increasing salience and support of pronatalist policies. Several people have turned to the IRS income tax code, which already includes some incentives regarding children. The Child Tax Credit (CTC), which lowers a person’s tax liability on a dollar-per-dollar basis, is the most obvious item that addresses children. The other tax credit is for child care expenses, but I won’t be focusing on that here.

Below are the 2021 marginal tax rate brackets and the standard deductions.  The standard deduction reduces the taxable income, and then the tax rates are applied.

After the tax liability is calculated, it’s reduced by any tax credits, such as the CTC. In 2021, households earned a credit of $3,600 for every child under 6 years old and $3,000 for every child under 18 years old.  Median household income in 2020 was $67,521.  That means that the tax liability was reduced by 5.3% – or 3/55ths – of median gross income. But, I have a problem with that.

Continue reading →

Covid-19 Didn’t Break the Supply Chains. You Did.

This is my last post in a series that uses the AS-AD model to describe US consumption during and after the Covid-19 recession. I wrote about US consumption’s broad categories, services, and non-durables. This last one addresses durable consumption.

During the week of thanksgiving in 2020, our thirteen-year-old microwave bit the dust. NBD, I thought. Microwaves are cheap, and I’m willing to spend a little more in order to get one that I think will be of better quality (GE, *cough*-*cough*). So, I filtered through the models on multiple websites and found the right size, brand, and wattage. No matter the retailer, at checkout I learned that regardless of price, I’d be waiting a good two months before my new, entirely standard, and unexceptional microwave oven would arrive. I’d have to wait until the end of January of 2021.

¡Que Ridiculo!

Continue reading →

AS-AD: From Levels to Percent

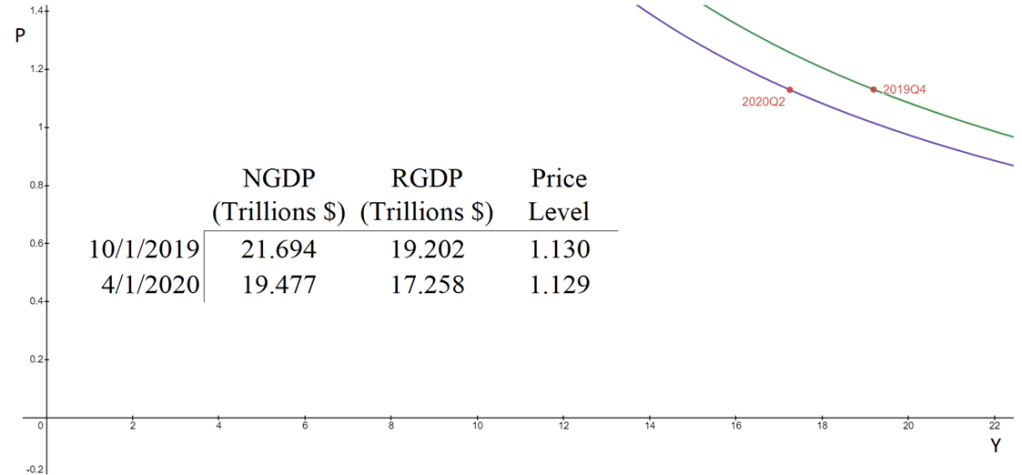
The aggregate supply & aggregate demand model (AS-AD) is nice because it’s flexible and clear. Often professors will teach it in levels. That is, they teach it with the level of output on one axis, and the price level on the other axis. This presentation is convenient for the equation of exchange, which can be arranged to reflect that aggregate demand (AD) is a hyperbola in (Y, P) space. Graphed below is the AD curve in 2019Q4 and in 2020Q2 using real GDP, NGDP, and the GDP price deflator.

The textbook that I use for Principles of Macroeconomics, instead places inflation (π) on the vertical axis while keeping the level of output on the horizontal axis. The authors motivate the downward slope by asserting that there is a policy reaction function for the Federal Reserve. When people observe high rates of inflation, state the authors, they know that the Fed will increase interest rates and reduce output. Personally, I find this reasoning to be inadequate because it makes a fundamental feature of the AS-AD model – downward sloping demand – contingent on policy context.

At the same time, I do think that it can be useful to put inflation on the vertical axis. Afterall, individuals are forward looking. We expect positive inflation because that’s what has happened previously, and we tend to be correct. So, I tell my students that “for our purposes”, placing inflation on the vertical axis is fine. I tell them that, when they take intermediate macro, they’ll want to express both axes as rates of change. I usually say this, and then go about my business of teaching principles.

But, what does it look like when we do graph in percent-change space?

Continue reading →

In Praise of the FRED Excel Add-in

Sometimes, large entities have enough money to throw at a problem that by sheer magnitude they produce something great (albeit at too high a cost). The iPhone app from the FRED is not that thing. But the Excel add-in is something that every macroeconomics professor should consider adding to their toolkit.

Personally, I include links to FRED content in the lecture notes that I provide to students. But FRED makes it easy to do so much more. They now have an add-in that makes accessing data *much* faster. With it, professors can demonstrate in excel their transformations that students can easily replicate. The advantage is that students can learn to access and transform their own data rather than relying on links that I provide them.

The tool is easy enough to find – FRED wants you to use it. After that, the installation is largely automatic.

Installed in excel you will see the below new ribbon option. It’s very user friendly.

Continue reading →

Dressed for Recess(ion)

In my previous post, I decomposed consumer expenditures to figure out which service sectors experienced the largest supply-side disruptions due to Covid-19. I illustrated that transportation & recreation services were the only consumer service to experience substantial and persistent supply shocks. Health, food, and accommodation services also experienced supply shocks, but quickly rebounded. Housing, utility, and financial services experienced no supply disruptions whatsoever.

What about non-durables?

Total consumption spending is the largest category of spending in our economy and is composed of services, durable goods, and non-durables. Services are the largest portion and durable goods compose the smallest portion. So, while there were plenty of stories during the Covid-19 pandemic about months-long delivery times for durables, they did not constitute the typical experience for most consumption.

Even though it’s not the largest category, many people think of non-durables when they think of consumption. Below is the break-down of non-durable spending in 2019. The largest singular category of non-durable spending was for food and beverages, followed by pharmaceuticals & medical products, clothing & shoes, and gasoline and other energy goods. Clearly, the larger the proportion that each of these items composes of an individual household budget, the more significant the welfare implications of price changes.

Continue reading →

It’s Still Hard to Find Good Help These Days

Consumption is the largest component of GDP. In 2019, it composed 67.5% of all spending in the US. During the Covid-19 recession, real consumption fell about 18% and took just over a year to recover. But consumption of services, composing 69% of consumption spending, hadn’t recovered almost two years after the 2020 pre-recession peak.  For those keeping up with the math, service consumption composed 46.5% of the economic spending in 2019.

We can decompose service consumption even further. The table below illustrates the breakdown of service consumption expenditures in 2019.

I argued in my previous post that the Covid-19 pandemic was primarily a demand shock insofar as consumption was concerned, though potential output for services may have fallen somewhat. When something is 67.5% of the economy, ‘somewhat’ can be a big deal. So, below I breakdown services into its components to identify which experienced supply or demand shocks. Macroeconomists often get accused of over-reliance on aggregates and I’ll be a monkey’s uncle if I succumb to the trope (I might, in fact be a monkey’s uncle).

Before I start again with the graphs, what should we expect? Let’s consider that the recession was a pandemic recession. We should expect that services which could be provided remotely to experience an initial negative demand shock and to have recovered quickly. We should expect close-proximity services to experience a negative demand and supply shock due to the symmetrical risk of contagion. Finally, we should expect that services with elastic demand to experience the largest demand shocks (If you want additional details for what the above service categories describe, then you can find out more here, pg. 18).

Continue reading →