Leopold said when he started his new blog that he would be thinking long-term. He has managed to stop staring at footage of the capital raid last week and produced a forward-looking blog. He is not the first person to speculate that the US has a vulnerability in its reliance on the country we buy the most stuff from.
Free trade is awesome. Something that is going to link together all EWED writers is a common respect for the power of trade to make lives better. Consumers who have access to world market can have much more great stuff. Enjoying your chair, or your phone, or you lightbulbs right now? It’s great to have access to more stuff and be able tot get it cheaper.
However, there are those who worry that if country A abandons domestic production of widget B, then in the unfortunate/unexpected event of a war, country A will be in trouble. For example, it would be concerning for a military power if they are not able to make any steel themselves.
Should country A use tariffs to stimulate domestic production? Tariffs really bother economists. Tariffs bite into the wonderful benefits of free trade. Since I talk to economists, I have heard a lot of arguments against tariffs. Leopold makes a novel argument against using tariffs to advance national security interests.
The problem with tariffs, however, is that they are royally ineffective at reducing the security vulnerability we are concerned about. A general tariff incentivizes onshoring the production that is cheapest and easiest to onshore—but it is likely the imports for which onshoring would be the most expensive and difficult that present the greatest security vulnerability, as I will explain. In the language of economics, I argue that the imports that present the greatest security vulnerability are those with the most inelastic import demand—while a general tariff most reduces those imports with the most elastic import demand.
I propose an alternative approach: general per-product quotas. These would better target vulnerability than a general tariff.
Instead of having tariffs, require that a certain number of several products be made domestically. That would be expensive, but we already put up with huge losses from tariffs. We already spend hundreds of billions of dollars on defense. The question is not whether we are going to spend money on defense. How can we spend money in the smartest way that recognizes how markets generate information? Think about the government buying 1,000 digital watches made on a friendly supply chain, and also dispensing with some costly tariffs.
Note that Leopold, if I understand him correctly, uses the word quota to mean that the government will buy a block of domestically produced goods at above-world-market prices. This is different from the way “quota” is sometimes used in international trade. See this MRU video narrated by Alex Tabarrok for a discussion of import quotas versus tariffs, a separate topic.
An American tourist in a foreign land surveys the surroundings. Down on the river he sees a boat at a distance coming into town. The men are being whipped as they row the boat filled-to-the-brim with fresh produce. Angered at the sight, the tourist rushes down to the dock to meet them as they unload. He tells the men of their value and worth. He yells at the man who whipped them. Then, a twist happens. The men explain that they were concerned they would not row fast enough and therefore were worried the fresh produce would spoil before getting to market. They hired the monitor to ensure they all rowed fast.
The source of that apocryphal story is unclear, but the economic content is rich. The men were concerned with the free-rider problem and sought a commitment device to ensure their fast rowing. How often are we willing to suffer the lashes of inefficiency to obtain some measure of the public good?
It’s the most wonderful time of the year, when we start to get all those little documents in the mail and electronically showing how much you earned in the past year. The purpose of these little documents, of course, is to complete your federal and state income tax returns. While many Americans dislike paying income taxes, there is another tax that is rated as even worse in surveys: the property tax.
Why do Americans dislike the property tax so much? One popular explanation is that people don’t like the idea that “you never really own your property.” In other words, even after you have paid off your mortgage, you must continue to pay property taxes, which feels like a form of “rent” that you pay to the government. Of course, that “rent” does pay for a variety of public services, primarily K-12 education in most locations, but this still seems to rub many Americans the wrong way. The libertarian phase “taxation is theft” conveys a similar sentiment for income taxes, that you never “really own” your own labor if you must pay taxes on your earnings.
But there is also an economic explanation for the hatred of the property tax: it is very salient, especially to taxpayers that no longer have a mortgage. While those of us that still have a mortgage on our home pay property taxes through our normal monthly mortgage payment, Americans that have paid off their mortgage typically write a check (or two) to pay the full amount of their property tax bill. An interesting paper by Cabral and Hoxby finds that jurisdictions with more taxpayers using escrow for their property taxes (meaning they have a mortgage) also have higher property tax rates. And furthermore, they “find that owners with tax escrow report their taxes much less accurately than those without tax escrow” (look at Figure 2 in the paper to see the huge differences).
Income taxes, on the other hand, are not salient for most Americans. Payroll withholding means that the taxes are taken out before we even get our paycheck, and you’ll only notice them if you look at your pay stub. And about three-quarters of US taxpayers get a tax refund at the end of the year. For most Americans, the only salient part of the income tax system is a check they receive as a refund, rather than writing a check for their property taxes.
What does all this mean? Should income taxes be made more salient? Should property taxes be made less salient? A simple answer could be that all taxes should be equally salient. Or if you view one tax as superior in some way, maybe that tax should be less salient, so there is less opposition to it.
I don’t have the answers to these questions. But I do have a question for readers: do you know your own income tax rate? Specifically, what is the marginal rate on your federal income taxes? I invite readers to write down their guesses, then look up the correct answer. How close were you? Please leave a comment, and be honest!
The U.S. economy as quantified by GDP has been sputtering along in slow growth mode for a number of years. It took a huge hit in 2020 due to covid shutdowns and has not nearly recovered. But stock prices have been rocketing upwards, and this past year is no exception. Markets took a cliff-dive in March, but have since way overshot to the upside.
Here is a plot of the past five decades of U.S. GDP and of the Wilshire 5000 index, which approximates the total stock market capitalization in the U.S.:
These two curves have crisscrossed each other over the past five decades, but in recent years the stock market has roared to the upside. One of Warren Buffet’s favorite metrics as to whether stock are overvalued is to consider the ratio of these two quantities, i.e. the market-capitalization-to-GDP (Cap/GDP) ratio:
My last post of 2020 tried to end the year on an optimistic note: the rapid innovation of a new vaccine was truly a marvel. But I also warned you that I would have a post in the new year talking about the deaths of 2020 during the pandemic. And here it is.
Throughout 2020, I have tried to keep up with the most recent data, not only on officially coded COVID-19 deaths, but also on other measures. An important one is known as excess mortality, which is an attempt to measure the number of deaths in a year that are above the normal level. Defining “normal” is sometimes challenging, but looking at deaths for recent years, especially if nothing unusual was happening, is one way to define normal. The team at Our World in Data has a nice essay explaining the concept of excess mortality.
One thing to remember about death data is that it is often reported with a lag. The CDC does a good job of regularly posting death data as it is reported, but these numbers can be unfortunately deceptive. For example, while the CDC has some death data reported through 51 weeks of 2020, but they note that death data can be delayed for 1-8 weeks, and some states report slower than others (for reasons that are not totally clear to me, North Carolina seems to be way behind in reporting, with very little data reporting after August).
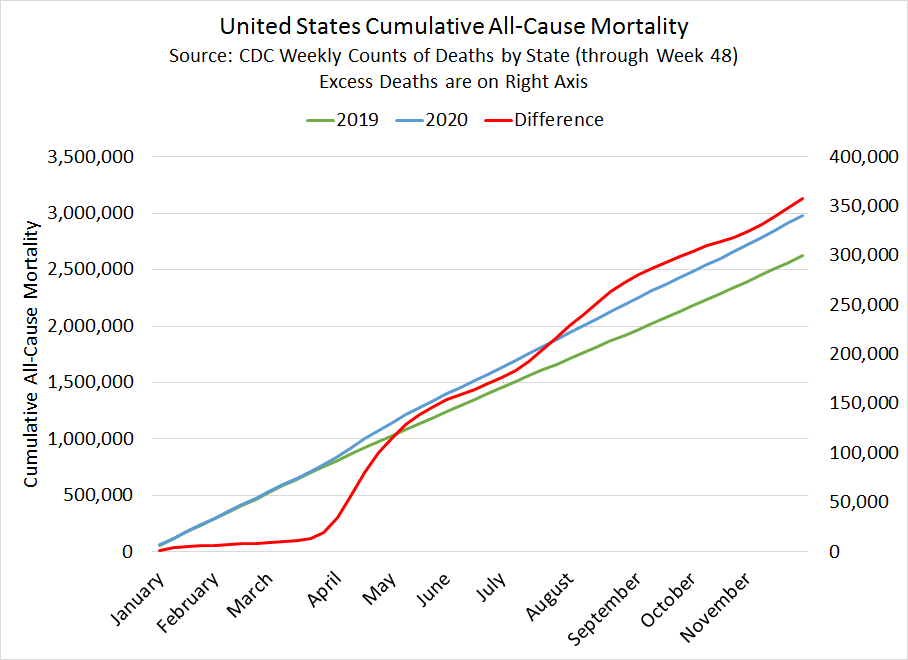
So there’s the caution. What can we do with this data? Since 2019 was a pretty “normal” year for deaths, we can compare the deaths in 2020 to the same weeks of data in 2019. In the chart at the right, I use the first 48 weeks of the year (through November), as this seems to be fairly complete data (but not 100% complete!). The red line in the chart shows excess deaths, the difference between 2019 and 2020 deaths. From this, we can see that there were over 357,000 excess deaths in 2020 in the first 11 months of the year, or about a 13.6% increase over the prior year.
Is 13.6% a large increase? In short, yes. It is very large. I’ll explain more below, but essentially this is the largest increase since the 1918 flu pandemic.
The Federal Reserve System has the ability create virtual dollars with the stroke of a key. They also issue the physical bills of U.S. currency ($1, $1, $2, $5, $10, $20, $50, and $100). The actual manufacturing of the bills for the Fed is done by the federal Bureau of Engraving and Printing.
Wouldn’t it be nice if you could just print up a bunch of $100 notes yourself? Well, the feds have already thought of that, and include an ever-growing array of features to make it hard to duplicate these bills.
Counterfeiting of dollar bills has a long history. Following a distasteful experience of runaway inflation with paper money during the Revolutionary War, the U.S. remained primarily on a gold standard for most of its existence. The first major issuance of paper money was in 1862, to help finance the Civil War. Counterfeiting of these bills soon became a major problem, with up to half the dollars in circulation being phony. A primary mission of the U.S. Secret Service when it was founded in 1865 was to combat counterfeiting.
During World War II, the Nazis in “Operation Bernhard” succeeded in producing enough counterfeit British money that the U.K. had to switch production of banknotes to a different format. The work was carried out by prisoners at concentration camps. Later in the war, the prisoners were tasked with counterfeiting U.S. currency as well. Due to the security features in the dollars, this was a more complex task. Also, the prisoners realized that their chance of being killed was higher after they succeeded in devising a process for making counterfeit dollars, so they slowed the work down as much as they could. The $100 bill has been a frequent target of more recent counterfeiters, including the British Anatasios Arnaouti gang and (allegedly) North Korea.
Modern U.S. currency includes numerous feature which make it difficult to duplicate. Only about 1 note in 10,000 in circulation is fake. You can click this link
to zoom in on each of the seven denominations of U.S. currency and see the current security features for each one. The more valuable bills get more sophisticated. The $100 bill has color-shifted numerals and bell image, a 3-D security ribbon with shifting images of bells and 100s, a security thread which glows under ultraviolet light, and subtle watermarks. Magnetic features are also included.
But it turns out that one of the most reliable and hard-to-duplicate features of dollars is the feel in your fingers, a result of the material they are made from and the printing process which gives a 3-D texture:
Perhaps the most difficult-to-duplicate counterfeit deterrence feature of U.S. banknotes is its unique yellow-green paper, manufactured under close security by a single U.S. firm from a mixture of 75 percent cotton and 25 percent flax. When combined with intaglio-printed images and numerals, this gives the notes a unique “feel,” which surveys have reported is the most common method of counterfeit detection by the public and bank employees.
So, if you want your own $100 bills, it looks like you will have to earn them, or wait for the next stimulus check to arrive.
EWVED could be our new name. Americans worked so hard to develop a vaccine (here’s Jeremy’s ode to development) and now we are seeing the distribution become painfully slow.
This is outrageous. Maryland has only administered 17% of the available vaccine doses and Gov. Hogan is blaming OWS for not delivering enough! And for not providing logistical and financial support for local departments.
We’ve already talked about different methods for distributing the vaccine in the face of limited supply on this blog (see my post and Doug Norton’s post). But today I want to talk about something different: the speed at which this vaccine was developed. It is truly amazing.
This chart from Nature (adapted from the fantastic Our World in Data) dramatically shows just how quickly the COVID-19 vaccine was developed compared with past vaccines. What used to take decades or even a century was done in mere months (yes, even with all the regulatory barriers today).
Exactly how we developed this vaccine so quickly is a complex story that involves the advanced state of modern science, incentives offered by concerned governments, and the harnessing of the profit motive to advance the public good. We don’t know all the details yet, and likely won’t for a long time since, like a pencil, no one person knows how to make and distribute a vaccine.
Along with the colorful phrase “pork barrel” spending, logrolling is a term used to describe the process of vote trading in elected legislative bodies. The process has long been maligned by political scientists, pundits, and the general public. It’s also come up in the debate about the proposed Budget/COVID Relief Bill.
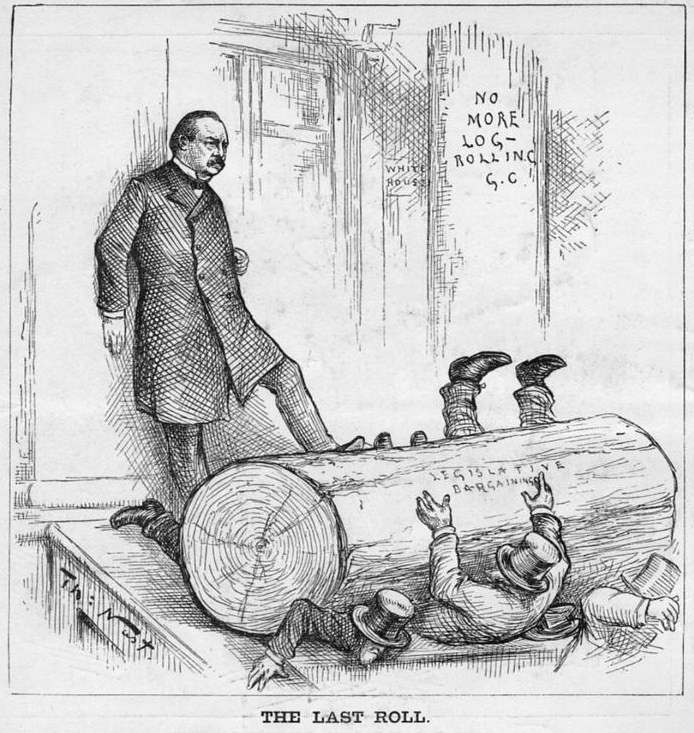
President Grant tried to stop logrolling. He failed.
What’s bad about logrolling? I think there are two general lines of argument. First, it just seems immoral. Citizens can’t legally trade their votes, and many see any attempt to do so as wrong. You get one vote, and one vote only. For someone to have more votes than others rubs our intuitions the wrong way, similar to the ability for wealthy individuals or corporations to essentially have more votes by influencing politicians through campaign contributions.
More pragmatically, logrolling gets a bad name because it could lead to wasteful spending, particularly the “pork barrel” type that Americans really hate (unless it is coming to their district, of course). If you vote for my bill, I will vote for yours, even though I might not care about your bill. Maybe even I think your bill is kinda bad, but I think my bill is really good, so I am willing to hold my nose and vote for your bill, if it gets me what I want.
Buchanan and Tullock (1962) turned this logic on its head. Logrolling is efficient because it allows members to express their preferences, specifically the intensity of their preferences. Moreover, it allows legislative bodies to get things done that are beneficial for society, even if none of those things would pass in a simple referendum.
Money can be simplistically defined as “A medium that can be exchanged for goods and services and is used as a measure of their values on the market, and/or a liquifiable asset which can readily be converted to the medium of exchange”. Earlier we described the amounts of various classes of “money” in the U.S. Here is a chart showing the amount of currency in circulation (coins and bills; lowest line on the chart) for 2005-2020, and also M1 (green), M2 (upper curve, purple) and “monetary base” (currency plus reserves at the Fed; red line).
To recap what M1 and M2 are:
M1: Physical currency circulating outside of the Fed and private banking system, plus the amount of demand deposits, travelers’ checks and other checkable deposits. This is highly “liquid” money, i.e. accepted and used for transactions in the private economy.
M2: M1 + most savings accounts, money market accounts, retail money market mutual funds, and small denomination time deposits (certificates of deposit of under $100,000).
The funds in these additional savings and money market accounts can in general be easily transferred to checkable accounts, and thus could go towards making purchases if desired.
Physical currency is made and put into circulation by the government or quasi-governmental agencies (the Treasury mints coins, and the Federal Reserve prints bills). But what about all the other money (M1, M2, etc.), which dwarfs the physical currency? How does it grow?
Without getting into all the weeds, it turns out that the major driver of money creation in modern economies is the process of bank loans. The vast majority of money in countries like the U.S. is not created directly by government or central bank operations, but is created in the private sector when commercial banks make loans. When individuals or companies decide to take out more loans (including loans for cars, houses, or business investment), the effective money supply in the nation increases. This is true for other modern economies. For instance, the Bank of England states:
There are three types of money in the UK economy:
3% Notes and coins
18% Reserves
79% Bank deposits
A typical scenario of how bank lending increases money might go something like this: Fred would like to add an enclosed back porch to his house, but doesn’t have the money in hand to pay a carpenter to build it for him. So the base case is no payment to the carpenter and no porch for Fred. However, Fred realizes he can go the bank and get a loan to pay for the porch. So he obtains a $20,000 loan from the bank, which first shows up as a $20,000 credit to Fred’s checking account. The bank credits Fred’s account, and in exchange obtains a contract from Fred promising that Fred will pay it back, with interest.
Fred writes a check for $20,000 to the carpenter, who in turn pays $10,000 to a lumberyard for materials and keeps the other $10,000 as his fee. The lumberyard is able to pay its workers for that day, and order replacement lumber from a mill. The workers spent their pay on various items. The carpenter puts $5000 of his $10,000 fee in a savings account, and pays the rest to a car dealer for a used car.
The initial loan to Fred set off a chain of spending and economic activity, which would not have otherwise occurred. Fred has his porch, the lumberyard workers continue to be employed and supporting their local merchants, the carpenter gets a second car, and this money keeps ricocheting around until it gets drained away into stagnant savings, or is used to pay down prior debt. Although they are not aware of it, part of the lumberyard workers’ pay for that day came out of the debt incurred by Fred.
The granting of that loan created $20,000 of spending capability, i.e. money. As far as the economy is concerned, that $20,000 did not exist as effective money prior to the loan. Thus, the money came into existence simultaneously with the debt associated with the loan. Fred received the capacity to spend $20,000 today, but in turn accepted the obligation to pay back this money, with interest. It is assumed that Fred had a stable income, such that he would in fact be able to pay back the loan in the future.
In general, increasing debt increases the money supply, and paying down debt extinguishes money. For simplicity, suppose Fred repays the $20,000 loan (with $2000 interest added) in one big lump, two years later. In that year, he will presumably spend into the economy something like $22,000 less than he would have otherwise. Thus, his paying down of his debt will act as a decrease in the circulating money.
In normal times, as one person is paying down his loan (and thereby shrinking the money supply), someone else is taking out a new and even larger loan, so total debt and the amount of money in circulation stays about the same, or grows somewhat. A feature of the 2008-2009 recession, however, was a big drop in consumer demand for credit; folks decided to pay down debts and not borrow so much money to buy stuff. The effect was a big drop in spending and thus in overall economic activity (GDP) and in employment.
Where was that $20,000 before Fred borrowed it? We might think that it was sitting unused in the bank vaults, just waiting to be borrowed. That turns out to be an incorrect picture of the lending process.
Bank loans differ in key ways from, say, an interpersonal loan. If I lend you money, I might draw down my checking deposit and give you a check which you would deposit in your bank account. No new money is created. You may hand me an I.O.U. slip stating when you will pay me back and with what interest, but that would still be just the same funds being traded back and forth between the two of us. I would have to have the money in my account to start with before I could loan it to you.
Bank lending is different. A bank can lend money and hence create a new deposit, which amounts to brand-new money, even if the bank does not have that money to start with. This is counterintuitive. In a later post we may flesh out this seemingly magical aspect of bank lending. See Overview of the U. S. Monetary System for a more complete discussion.