Grosch, Kerstin, Simone Haeckl, and Martin G. Kocher. “Closing the gender STEM gap-A large-scale randomized-controlled trial in elementary schools.” (2022).
These authors were thinking about the same problem at the same time, unbeknownst to me. In their introduction they write, “We currently know surprisingly little about why women still remain underrepresented in STEM fields and which interventions might work to close the gender STEM gap.”
My conclusion from my paper is that, by college age, subjective attitudes toward tech are very important. This leads to the questions of whether those subjective attitudes are shaped at younger ages. Grosch et al. have run an experiment to target 3rd-graders with a STEM-themed game. I’ll quote their description:
The treatment web application (treatment app) intends to increase interest in STEM directly by increasing knowledge and awareness about STEM professions and indirectly by addressing the underlying behavioral mechanisms that could interfere with the development of interest in STEM. The treatment app presents both fictitious and real STEM professionals, such as engineers and programmers, on fantasy planets. Accompanied by the professionals, the children playfully learn more about various societal challenges, such as threats from climate change and to public health, and how STEM skills can contribute to combating them. The storyline of the app comprises exercises, videos, and texts. The app also informs children about STEM-related content in general. To address the behavioral mechanisms, the app uses tutorials, exercises, and (non-monetary) rewards that teach children a growth mindset and improve their self-confidence and competitive aptitude. Moreover, the app introduces female STEM role models to overcome stereotypical beliefs. To test the app’s effect, we recruited 39 elementary schools in Vienna (an urban area) and Upper Austria (a predominantly rural area).
This is a preview of their results, although I recommend reading their paper to understand how these measurements were made:
Girls’ STEM confidence increases significantly in the treatment group (difference: 0.047 points or 0.28 standard deviations, p = 0.002, Wald test), and the effect for girls is significantly larger than the effect for boys.
Result 2: Children’s competitiveness is positively associated with children’s interest in STEM. We do not find evidence that stereotypical thinking and a growth mindset is associated with STEM interest.
Lastly, my kids play STEM-themed tablet games. PBS Kids has a great suite of games that are free and educational. Unfortunately, I have not tried to treat one kid while giving the other kid a placebo app, so my ability to do causal inference is limited.
This is the second of two blog posts on my paper “Willingness to be Paid: Who Trains for Tech Jobs”. Follow this link to download the paper from Labour Economics (free until November 27, 2022).
Women did not reject a short-term computer programming job at a higher rate than men.
For the incentivized portions of the experiment, women had the same reservation wage to program. Women also seemed equally confident in their ability after a belief elicitation.
The main gender-related outcomes were, surprisingly, null results. I ran the experiment three times with slightly different subject pools.
However, I did find that women might be less likely to pursue programming outside of the experiment based on their self-reported survey answers. Women are more likely to say they are “not confident” and more likely to say that they expect harassment in a tech career.
In all three experiments, the attribute that best predicted whether someone would program is if they say they enjoy programming. This subjective attitude appears more important even than having taken classes previously.
Along with “enjoy programming” or “like math”, subjects who have a high opportunity cost of time were less willing to return to the experiment to do programming at a given wage level.
I wrote this paper partly written to understand why more people are not attracted to the tech sector where wages are high. This recent tweet indicates that, although perhaps more young people are training for tech than ever before, the market price for labor is still quite high.
The tech wages are too damn high.
— Antonio García Martínez (agm.eth) (@antoniogm) October 7, 2022
The neat thing about controlled experiments is that you can randomly assign treatment conditions to subjects. This post is about what happened after adding either extra information or providing encouragement to some subjects.
Informed by reading the policy literature, I assumed that a lack of confidence was a barrier to pursuing tech. A large study done by Google in 2013 suggested that women who major in computer science were influenced by encouragement.
I provided an encouraging message to two treatment groups. The long version of this encouraging message was:
If you have never done computer programming before, don’t worry. Other students with no experience have been able to complete the training and pass the quiz.
Not only did this not have a significant positive effect on willingness to program, but there is some indication that it made subjects less confident and less willing to program. For example, in the “High Stakes” experiment, the reservation wage for subjects who had seen the encouraging message was $13 more than for the control subjects.
My experiment does not prove that encouragement never matters, of course. Most people think that a certain type of encouragement nudges behavior. My results could serve as a cautionary tale for policy makers who would like to scale up encouragement. John List’s latest book The Voltage Effect discusses the difficulty of delivering effective interventions at scale.
The other randomly assigned intervention was extra information, called INFO. Subjects in the INFO treatment saw a sample programming quiz question. Instead of just knowing that they would be doing “computer programming,” they saw some chunks of R code with an explanation. In theory, someone who is not familiar with computer programming could be reassured by this excerpt. My results show that INFO did not affect behavior. Today, most people know what programming is already. About half of subjects said that they had already taken a class that taught programming. Perhaps, if there are opportunities for educating young adults, it would be in career paths rather than just the technical basics.
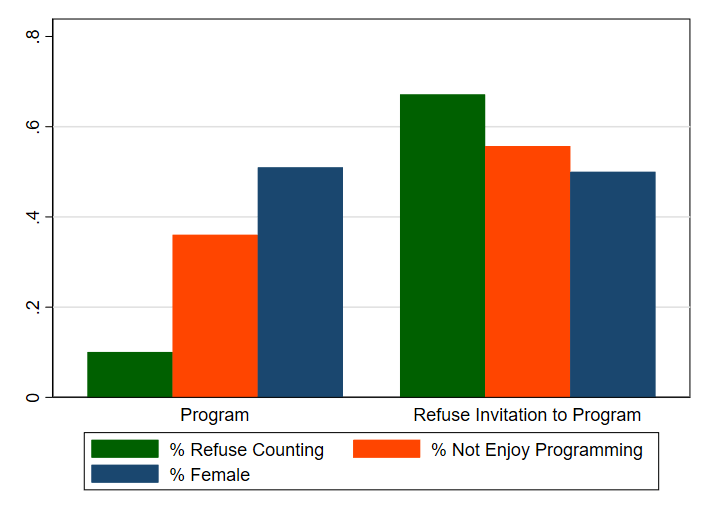
Since the differences between treatments turned out to be negligible, I pooled all of my data (686 subjects total) for certain types of analysis. In the graph below, I group every subject as either someone who accepted the programming follow-up job or as someone who refused to return to program at any wage. Recall that the highest wage level I offered was considerably higher on a per-hour basis than what I expect their outside earning option to be.
Fig. 5. Characteristics of subjects who do not ask for a follow-up invitation, pooling all treatments and sample
I’ll discuss the three features in this graph in what appear to be the order of importance for predicting whether someone wants to program. There was an enormous difference in the percent of people who were willing to return for an easy tedious task that I call Counting. By inviting all of these subjects to return to count at the same hourly rate as the programming job, I got a rough measure of their opportunity cost of time. Someone with a high opportunity cost of time is less likely to take me up on the programming job. This might seem very predictable, but this is a large part of the reason why more Americans are not going into tech.
Considering the first batch of 310 subjects, I have a very clean comparison between the programming reservation wage and the reservation wage for counting. People who do not enjoy programming require a higher payment to program than they do to return for the counting job. Self-reported enjoyment is a very significant factor. The orange bar in the graph shows that the majority of people who accepted the programming job say that they enjoy programming.
Lastly, the blue bar shows the percent of female subjects in each group. The gender split is nearly the same. As I show several ways in the paper, there is a surprising lack of a gender gap for incentivized decisions.
I hope that my experiment will inspire more work in this area. Experiments are neat because this is something that someone could try to replicate with a different group of subjects or with a change to the design. Interesting gaps could open up between subject types under new circumstances.
The topic of skill problems in the US represents something reasonably new for labor market and public policy discussions. It is difficult to think of a labor market issue where academic research or even research using standard academic techniques has played such a small role, where parties with a material interest in the outcomes have so dominated the discussion, where the quality of evidence and discussion has been so poor, and where the stakes are potentially so large.
Cappelli, PH, 2015. Skill gaps, skill shortages, and skill mismatches: evidence and arguments for the United States. ILR Rev. 68 (2), 251–290.
I am pleased to announce that my paper “Willingness to be Paid: Who Trains for Tech Jobs?” has been accepted at Labour Economics.
Having a larger high-skill workforce increases productivity, so it is useful to understand how workers self-select into high-paying technology (tech) jobs. This study examines how workers decide whether or not to pursue tech, through an experiment in which subjects are offered a short programming job. I will highlight some results on gender and preferences in this post.
Most of the subjects in the experiment are college students. They started by filling out a survey that took less than 15 minutes. They could indicate whether or not they would like an invitation for returning again to do computer programming.
Subjects indicate whether they would like an invitation to return to do a one-hour computer programming job for $15, $25, $35, …, or $85.[1]This is presented as 9 discrete options, such as:
“I would like an invitation to do the programming task if I will be paid $15, $25, $35, $45, $55, $65, $75 or $85.”,
or,
“I would like an invitation to do the programming task if I will be paid $85. If I draw a $15, $25, $35, $45, $55, $65 or $75 then I will not receive an invitation.”,
and the last choice is
“I would not like to receive an invitation for the programming task.”
Ex-ante, would you expect a gender gap in the results? In 2021, there was only 1 female employee working in a tech role at Google for every 3 male tech employees. Many technical or IT roles exhibit a gender gap.
To find a gender gap in this experiment would mean female subjects reject the programming follow-up job or at least they would have a different reservation wage. In economics, the reservation wage is the lowest wage an employee would accept to continue doing their job. I might have observed that women were willing to program but would reject the low wage levels. If that had occurred, then the implication would be that there are more men available to do the programming job for any given wage level.
However, the male and female participants behaved in very similar ways. There was no significant difference in reservation wages or in the choice to reject the follow-up invitation to program. The average reservation wage for the initial experiment was very close to $25 for both males and females. A small number of male subjects said they did not want to be invited back at even the highest wage level. In the initial experiment, 5% of males and 6% of females refused the programming job.
The experiment was run in 3 different ways, partly to test the robustness of this (lack of) gender effect. About 100 more subjects were recruited online through Prolific to observe a non-traditional subject pool. Details are in the paper.
Ex-ante, given the obvious gender gap in tech companies, there were several reasons to expect a gender gap in the experiment, even on a college campus. Ex-post, readers might decide that I left something out of the design that would have generated a gender gap. This experiment involves a short-term individual task. Maybe the team culture or the length of the commitment is what deters women from tech jobs. I hope that my experiment is a template that researchers can build on. Maybe even a small change in the format would cause us to observe a gender gap. If that can be established, then that would be a major contribution to an important puzzle.
For the decisions that involved financial incentives, I observed no significant gender gaps in the study. However, subjects answered other questions and there are gender gaps for some of the self-reported answers. It was much more likely that women would answer “Yes” to the question
If you were to take a job in a tech field, do you expect that you would face discrimination or harassment?
I observed that women said they were less confident if you just asked them if they are “confident”. However, when I did an incentivized belief elicitation about performance on a programming quiz, women appear quite similar to men.
Since wages are high for tech jobs, why aren’t more people pursing them? The answer to that question is complex. It does not all boil down to subjective preferences for technical tasks, however in my results enjoyment is one of the few variables that was significant.
People who say they enjoy programming are significantly more likely to do it at any given wage level, in this experiment.
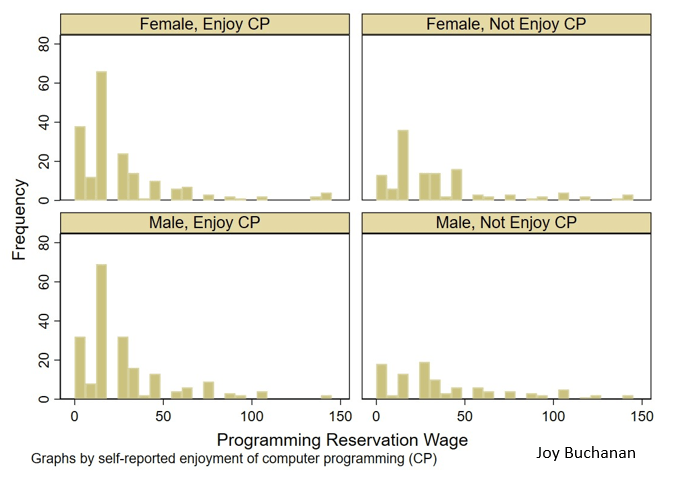
Fig. 3 Histogram of reservation wage for programming job, by reported enjoyment of computer programming (CP) and gender, pooling all treatments and samples
Figure 3 from the paper shows the reservation wage of participates from all three waves. Subjects who say that they enjoy programming usually pick a reservation wage at or near the lowest possible level. This pattern is quite similar whether you are considering males or females.
Interestingly, enjoyment mattered more than some of the other factors that I though would predict willingness to participate. About half of subjects said they had taken a class that taught them some coding, but that factor did not predict their behavior in the experiment. Enjoyment or subjective preferences seemed to matter more than training. To my knowledge, policy makers talk a lot about training and very little about these subjective factors. I hope my experiment helps us understand what is happening when people self-select into tech. Later, I will write another blog about the treatment manipulation and results, and perhaps I will have the official link to the article by then.
Buchanan, Joy. “Willingness to be Paid: Who Trains for Tech Jobs.” Labour Economics.
[1] We use a quasi-BDM to obtain a view of the labor supply curve at many different wages. The data is not as granulated as that which a traditional Becker-DeGroot-Marschak (BDM) mechanism obtains, but it is easy for subjects to understand. The BDM, while being theoretically appropriate for this purpose, has come under suspicion for being difficult for inexperienced subjects to understand (Cason and Plott, 2014). We follow Bartling et al. (2015) and use a discrete version.
Yesterday Federal Reserve researcher Nathan Blascak presented a paper at my Economics Seminar Series that was a surprise hit, with the audience staying over 40 minutes past the end to keep asking questions. So today I’ll share some highlights from the paper, “Decomposing Gender Differences in Bankcard Credit Limits”.
The challenge here is that its hard to get data that includes both gender and credit card limits (its illegal to use gender as a basis for allocating credit, so credit card companies don’t keep data on it, as they don’t want to be suspected of using it). The paper is original for managing to do so, by merging three different datasets. But even this merged data only lets them do this for a fairly specific subgroup- Americans who hold a mortgage solely in their name (not jointly with a spouse). Even this limited data, though, is quite illuminating.
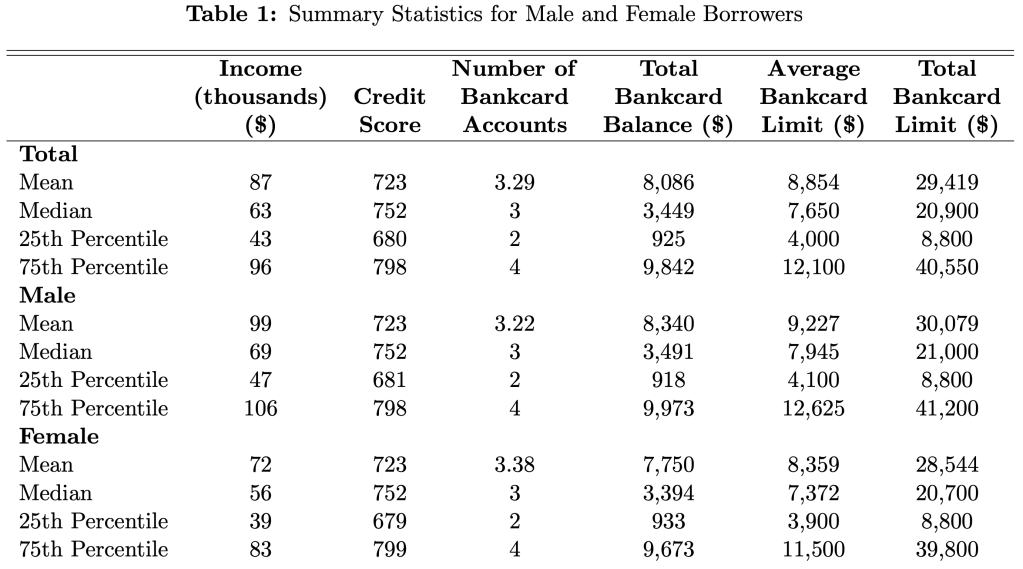
Their headline result is that men have 4.5% higher credit limits than women. Women actually have slightly more credit cards (3.38 vs 3.22), but have lower limits on each card; summing up their total credit limit across all cards yields an average of $28,544 for women vs $30,079 for men.
Two of the big factors that determine limits, and so could cause this difference, are credit scores and income. The table above shows that men and women have remarkably similar credit scores, while men have higher incomes. Still, when the paper tries to predict credit limits, controlling for credit scores, incomes, and other observables explains only about 13% of the gender gap.
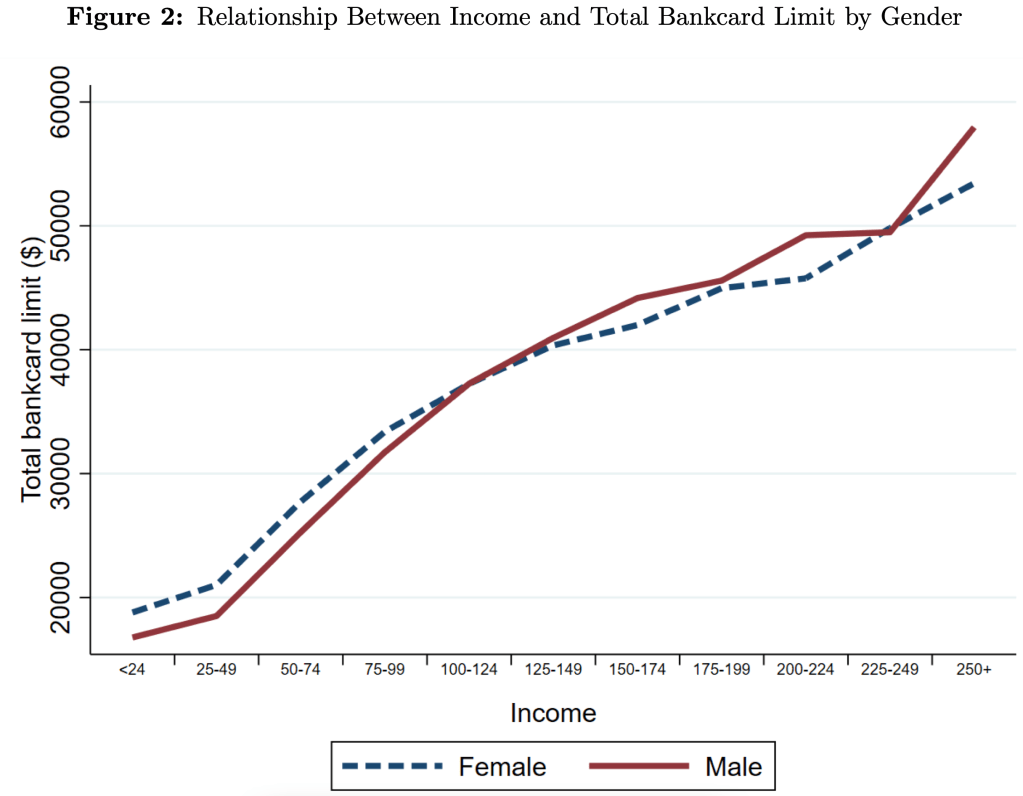
Men have 4.5% higher credit limits on average, but this difference varies a lot across the distribution. For credit scores, the gap is narrow in the middle but bigger at the extremes. For income, we see that men get higher limits at higher incomes, but women actually get higher limits at lower incomes- and not just “low incomes”, women do better all the way up to $100,000/yr:
The papers data covers 2006-2018, so they also show all sorts of interesting trends. The average number of credit cards held by men and women plunged after the 2008 recession and remains well below the peak. Total credit limits plunged too, though they were almost totally recovered by 2018.
There’s lots more in the paper, which is a great example of the value of descriptive work with new data. If anything I’d like to see the authors push even harder on the distribution angle. Its nice to see how limits vary across all incomes and credit scores, but why not show the full distribution of credit card limits by gender? My guess is that the 1st and 99th percentiles are very interesting places, because there’s all sorts of crazy behavior at the extremes. Finally, I wonder if higher limits are actually a good thing once you get beyond a relatively low amount- do you know of anyone who ever had a good reason to get their personal credit card balances over $20,000?
I just published a paper on CON laws and spending in Contemporary Economic Policy. As frequent readers of this blog will know, CON laws in 34 states require healthcare providers in 34 US states to get permission from a state board before opening or expanding, and one goal of the laws is to reduce health care spending. The contribution we aim for in this paper is to lay out a theoretical framework for how these laws affect spending.
There have been many empirical papers on this, typically finding that CON laws increase spending, but the only theory explaining why has been simple supply and demand. Health care markets are hard to model for a few reasons, but one big one is that most spending is done through insurers, so the price consumers pay is typically quite a bit lower than the price producers receive. This leads to “moral hazard”- i.e. overuse and overspending by consumers. Normally economists hate monopolies because they lead to underproduction, so in a market with overuse its fair to ask (as Hotelling did about nonrenewable resources)- could two market failures (moral hazard overuse and monopoly underuse) cancel each other out?
You can download my full paper “If Wages Fell During a Recession” with Dan Houser from the Journal of Economic Behavior and Organization (only free until September 24, 2022).
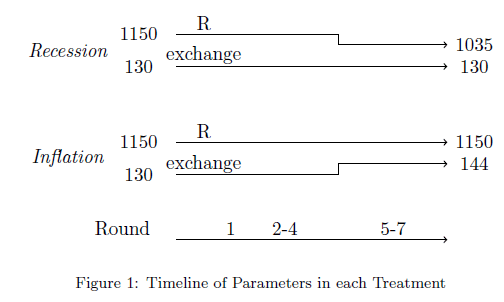
There is a simulated recession in our experiment. We ask what happens if employers cut wages in response. Although nominal wage cuts are rare in the outside world, some of our lab subjects cut the wages of their “employee”. Employees retaliated against nominal wage cuts by shirking, such that the employers probably would have been better off keeping wages rigid.
We also tried the same thing with an inflation shock that allowed the employer to institute a real wage cut without a nominal wage cut. The reaction to that real wage cut was muted compared to the retaliation against the obvious nominal wage cut.
Inflation was implemented after 3 rounds of the same wage to create a reference point.
The Great Recession happened when I was an undergraduate. As I started my career in research, the issue of employment and recessions seemed like THE problem to work on. The economy of 2022 is so different from the years that inspired this experiment! Below I’ll highlight current events and work from others on this topic.
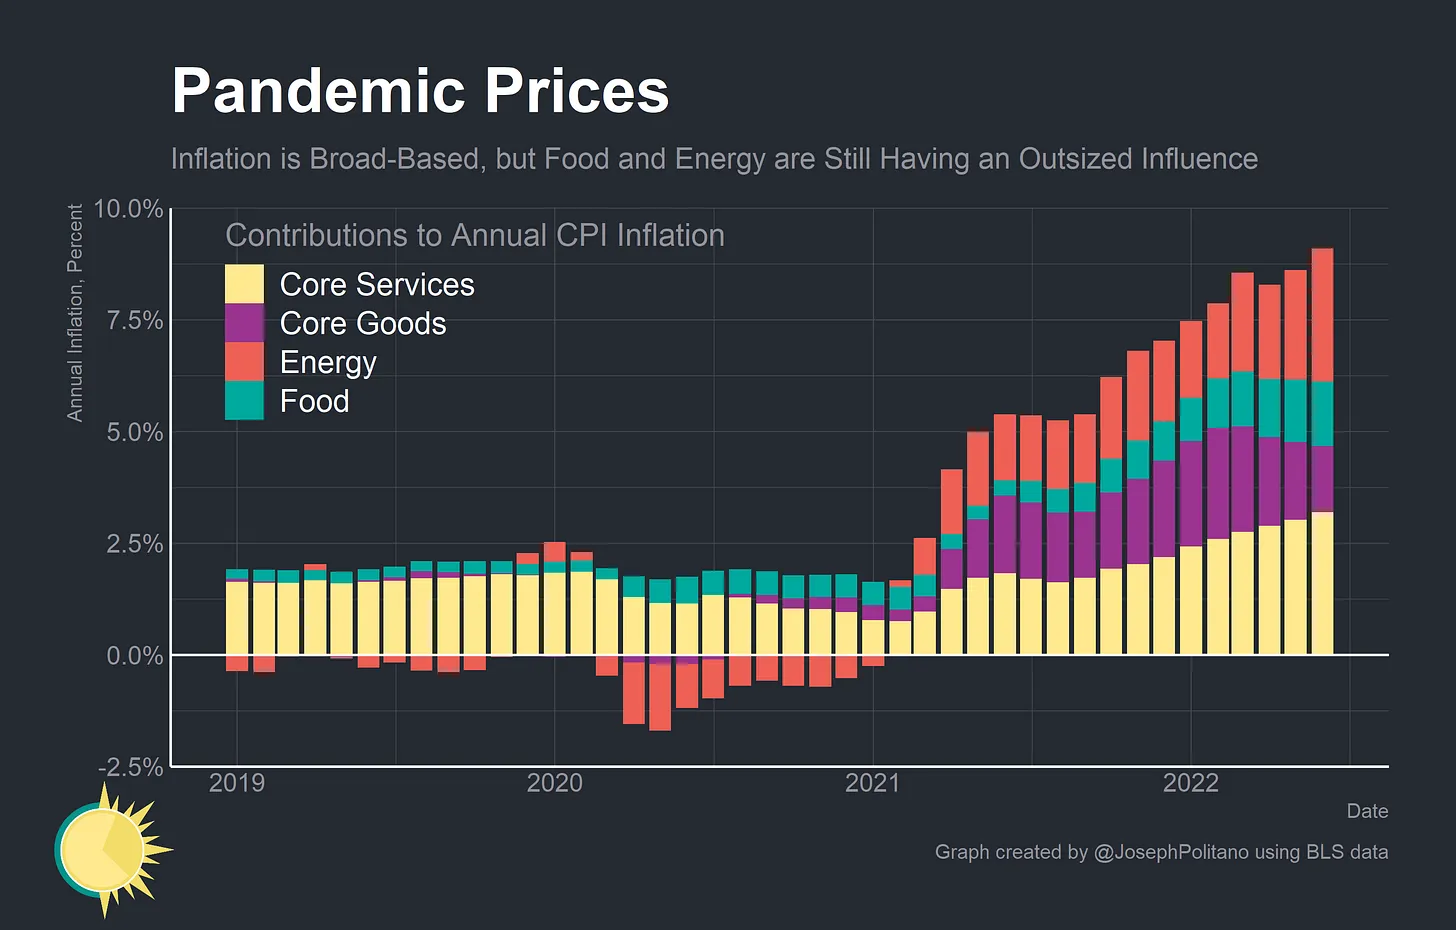
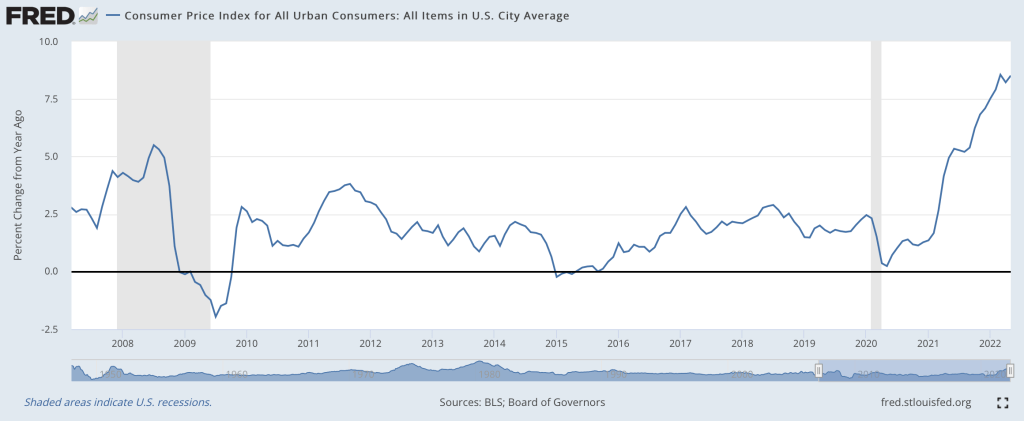
Inflation used to be something Americans could almost ignore, and now it’s at the highest level I have seen in my lifetime. Suddenly, people are so mad about inflation that politicians named their bill the Inflation Reduction Act just to make it popular.
The EWED crew has made lots of good posts on inflation. Although job openings and (nominal) wage increases are noticeable right now, Jeremy explored whether inflation has wiped out apparent wage growth.
More recently, the WSJ reports that real wages are down because inflation is so high. “Wage gains haven’t kept pace with inflation. Private-sector wages and salaries declined 3.1% in the second quarter from a year earlier, when accounting for inflation.”
Firms in 2022 did not just sit back and let real wages get eroded exactly proportional to inflation. But it is also not the case that Americans got a raise of 9% to exactly offset inflation. According to our experiment, there would be outrage if workers were experiencing a nominal wage cut in proportion to the real wage cut they are getting right now.
The high inflation combined with a hot job market makes this current economy hard to compare to anything in our recent history. Brian at Price Theory explained that inflation pressure is coming from both supply and demand factors.
Most Americans are covered by employer-sponsored health insurance, either through their own job or a family member’s. This can make it difficult to switch jobs- the new job might not offer insurance, or might have a worse insurance plan or network- locking people into their current job.
Economists have documented since at least the 1980’s how our insurance system seems to reduce job mobility. Several reforms have tried to improve the situation- COBRA, HIPAA, and most recently the Affordable Care Act.
In a paper published this week, Gregory Colman, Dhaval Dave and I evaluate how the extent of “job lock” has changed over time. In short, we find that job lock remains substantial and the Affordable Care Act doesn’t appear to have done anything to improve the situation. The paper has many tables of regression results, but the pictures tell the basic story:
Trends in job mobility for those with and without employer-sponsored insurance (ESI) using Current Population Survey data
The details differ a bit depending on which dataset and identification strategy we use, but a few things are clear:
Macroeconomic factors are dominant in the short run; mobility falls during recessions like 2001 and 2007, then recovers.
The long run trend has been toward lower job mobility for those with AND without employer-based insurance
Those without employer-based insurance are still much more likely to switch jobs (we find 25-45% more likely)
To the extent that this gap has closed since the year 2000, it has come through falling job mobility for those without employer-based insurance more than rising job mobility for those with employer-based insurance
Why does the Affordable Care Act appear not to have improved things? This remains unanswered, but we conclude the paper with some hypotheses:
In fact, our point estimates suggest that job lock actually got stronger following the ACA. One possible explanation for our finding is that the ACA’s individual mandate made insurance even more desirable by fining the uninsured. Another possibility is that workers continue to value employer-provided health insurance more over time as premiums continue to rise
I was in Austin Texas for the first time this week for the first in-person meeting of the American Society of Health Economists since 2019. Some quick impressions on Austin:
Austin reminds me of many Southern cities, but Nashville most of all. Both historic state capitals that are booming, lots of people moving in and new infrastructure actually being built, forests of cranes putting up new glass towers. Both filled with bars, restaurants, and especially live music. But even with so much happening and so much being built, they don’t *feel* dense, you can always see lots of sky even downtown.
Austin seems to be a bizarre “pharmacy desert”, I think I walked 14 miles all through town before I saw one. Contrast to NYC with a Duane Reade on every block. In fact downtown seemed to have almost no chains of any kind, restaurants included; I wonder if this is just about consumer preferences or there’s some sort of anti-chain law.
Good brisket and tacos, as expected
Most US cities have redeveloped their waterfronts the last few decades to make them pleasant places to be, but Austin has done particularly well here, many miles of riverfront trails right downtown.
In one sense, it seems like advice does not work. Advice is often ignored and sometimes even resented. People are going to just do what they want.
And yet, many people were in fact influenced by advice at some point in some situation. Many people can tell you about a mentor they spoke with or a book they read. Somehow, we do indeed need to learn about our environments and make choices about career and health and relationships. So, advice does work, sometimes.
A trivial example is why I stopped putting sugar in my coffee. A random anonymous message board post said that you should stop putting sugar in your coffee and your taste will adjust. “You won’t even miss it,” the anonymous poster told me. From that day forward, I stopped putting sugar in my coffee. I’m healthier and I don’t miss it. I was “nudged”. I was also predisposed to make this healthy decision, and I had sought out advice.
We might overestimate the effectiveness of advice because when people bother to talk about it, they mention the one time it affected them. First, they fail to mention the thousands of messages that had no effect (personally I still eat all kinds of junk food that contain sugar despite getting warnings to stop). And secondly, some decisions (perhaps including my coffee-sugar example) would have been made eventually without the advice event. Even recognizing those limitations, I still believe that messaging works sometimes.
It is tempting to think that, at almost zero cost, you could nudge people into making different decisions, just by sending them messages. There is a growing literature on this topic. Economists like myself are collecting data on whether it works.
One of these papers was just published:
Halim, Daniel, Elizabeth T. Powers, and Rebecca Thornton. 2022. “Gender Differences in Economics Course-Taking and Majoring: Findings from an RCT.” AEA Papers and Proceedings, 112: 597-602.
We implemented an RCT among undergraduate students enrolled in large introductory economics courses at the University of Illinois at Urbana Champaign. Two treatment arms provided encouragement to major in economics. A “prosocial” treatment provided information emphasizing the wide variety of career options and personal benefits associated with the major, while an “earnings” treatment provided information on financial returns. We evaluate the effects of the two treatments on subsequent choices to take another economics course and declaration of the economics major by the end of the student’s junior year using student-level matched administrative data. … Our primary aim is to evaluate whether women can be “nudged” into a major with low-cost, theoretically grounded, encouragement/information interventions.
Our primary sample consists of 1,976 students who were freshmen or sophomores during the focal course.
We find that the average male student receiving either treatment is more likely to take at least one more economics course after the focal course, but there is little evidence of increased majoring. The average woman appears unresponsive to either treatment.
Treated women with better than-expected focal-course performance are nudged to take an additional economics course. The likelihood that a woman takes another course in response to treatment increases by 5.6-5.9%-points with a favorable one-third- grade “surprise”. The hypothesis of treatment effects on women’s majoring, mediated or not, is rejected. Men’s susceptibility to treatment is invariant with respect to focal course performance.
Women did not demonstrate a bias towards a pro-social framing, and men did not demonstrate a bias towards a pro-earnings framing.
The pile of null results for messaging, when it is randomly assigned, is growing. It’s good to see null results get published though.
One of my current projects is related, but with a focus on computer programming instead of majoring in economics.
I think so, though the path back to 2% is a long one. Two months ago I wrote that “the Fed is still under-reacting to inflation“. We’ve had an eventful two months since; last Friday the BLS announced CPI prices rose 1% just in May, and that:
The all items index increased 8.6 percent for the 12 months ending May, the largest 12-month increase since the period ending December 1981
Then this Wednesday the Fed announced they were raising interest rates by 0.75%, the biggest increase since 1994, despite having said after their last meeting that they weren’t considering increases above 0.5%. I don’t like their communications strategy, but I do like their actions this month. This change in the Fed’s stance is one reason I think we’re at or near the peak.
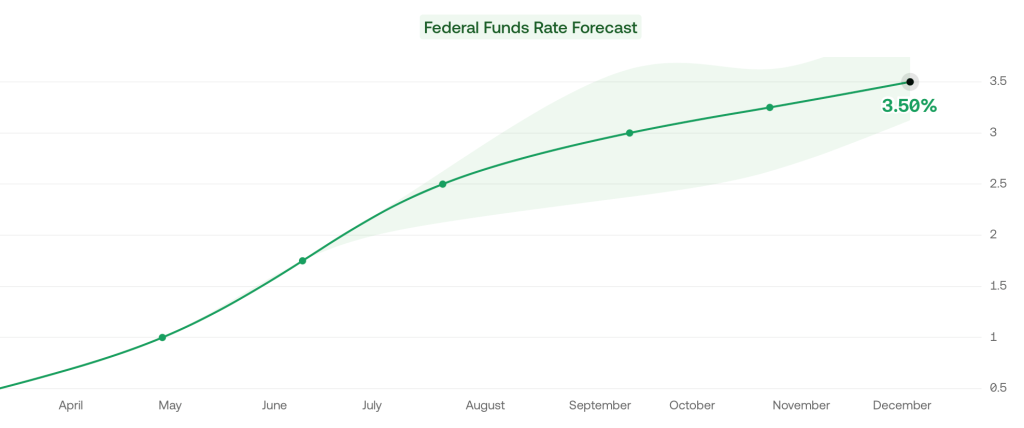
Its not just what the Fed did this week, its the change in their plans going forward. As of April, the Fed said the Fed Funds rate would be 1.75% in December, and markets thought it would be 2.5%. But now the Fed and markets both project 3.5% rates in December.
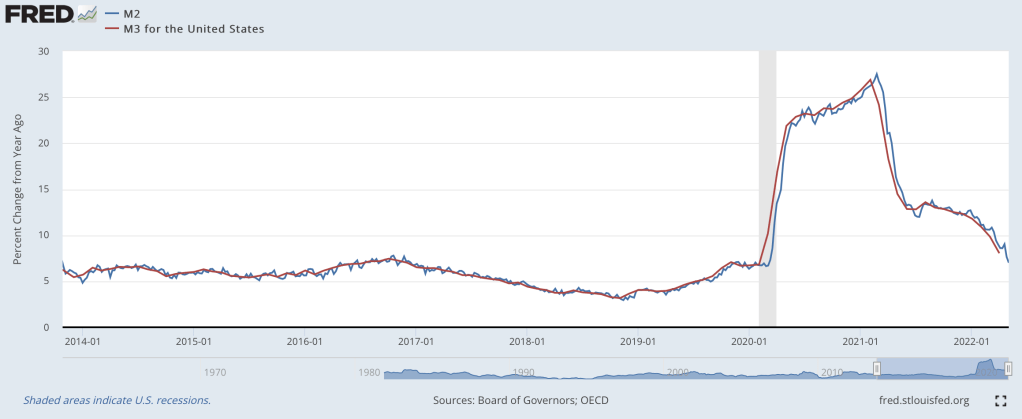
The other reason I’m optimistic is that the days of rapid money supply growth continue to get further behind us. From March to May 2020, the M2 and M3 supply exploded, growing at the fastest pace in at least 40 years:
Rapid inflation began about 12 months later. But the rate of money supply growth peaked in February 2021, then began a rapid decline. Based on the latest data from April 2022, money supply growth is down to 8%, a bit high but finally back to a normal range. Money supply changes famously influence prices with “long and variable lags”, so its hard to call the top precisely. But the fact that we’re now 15 months past the peak of money supply growth (and have stable monetary velocity) is encouraging. Old-fashioned money supply is the same indicator that led Lars Christiansen to predict this high inflation in April 2021 after successfully predicting low inflation post-2009 (many people got one of those calls right, but very few got both).
Stocks also entered an official bear market this week (down 20% from highs), which is both a sign of excess money no longer pumping up markets, and a cause of lower demand going forward.
Markets seem to agree with my update: 5-year breakevens have fallen from a high of 3.6% back in March down to 2.9% today, implying 2.9% average inflation over the next 5 years. Much improved, though as I said at the top the path to 2% will be a long one- think years, not months. Even the Fed expects inflation to be over 5% at the end of this year, and for it to fall only to 2.6% next year.
What am I still worried about? The Producer Price Index is still growing at 20%. The Fed is raising rates quickly now but their balance sheet is still over twice its pre-Covid level and is shrinking very slowly. The Russia-Ukraine war drags on, keeping oil and gas prices high, and we likely still have yet to see its full impact on food prices. Making good predictions is hard.
While I’m sticking my neck out, I’ll make one more prediction, though this one is easier- Dems are in for a bad time in November. A new president’s party generally does badly at his first midterm, as in 2018 and 2010. But this time the economy will be a huge drag on top of that. November is late enough that the real economy will be notably slowed by the Fed’s inflation-fighting effects, but not so late that inflation will be under control (I expect it to be lower than today but still above 5%). Markets currently predict a 75% chance that Republicans take the House and Senate in November, and if anything that seems low to me.