Two months ago I wrote about gasoline prices and tried to give the current prices some historical context. Gas prices have, of course, only continued to increase since then. Here’s a chart I created to give a bit more context, using an idea from Ryan Radia: how much does it cost to drive a car 250 miles? Since fuel efficiency has increased over time, we might be understating how much it costs to drive today relative to the past. And of course, to give the “cost” proper context I have stated in terms of hours worked at the average wage (note: the final data point is from April 2026, as we don’t have wage data for May yet):
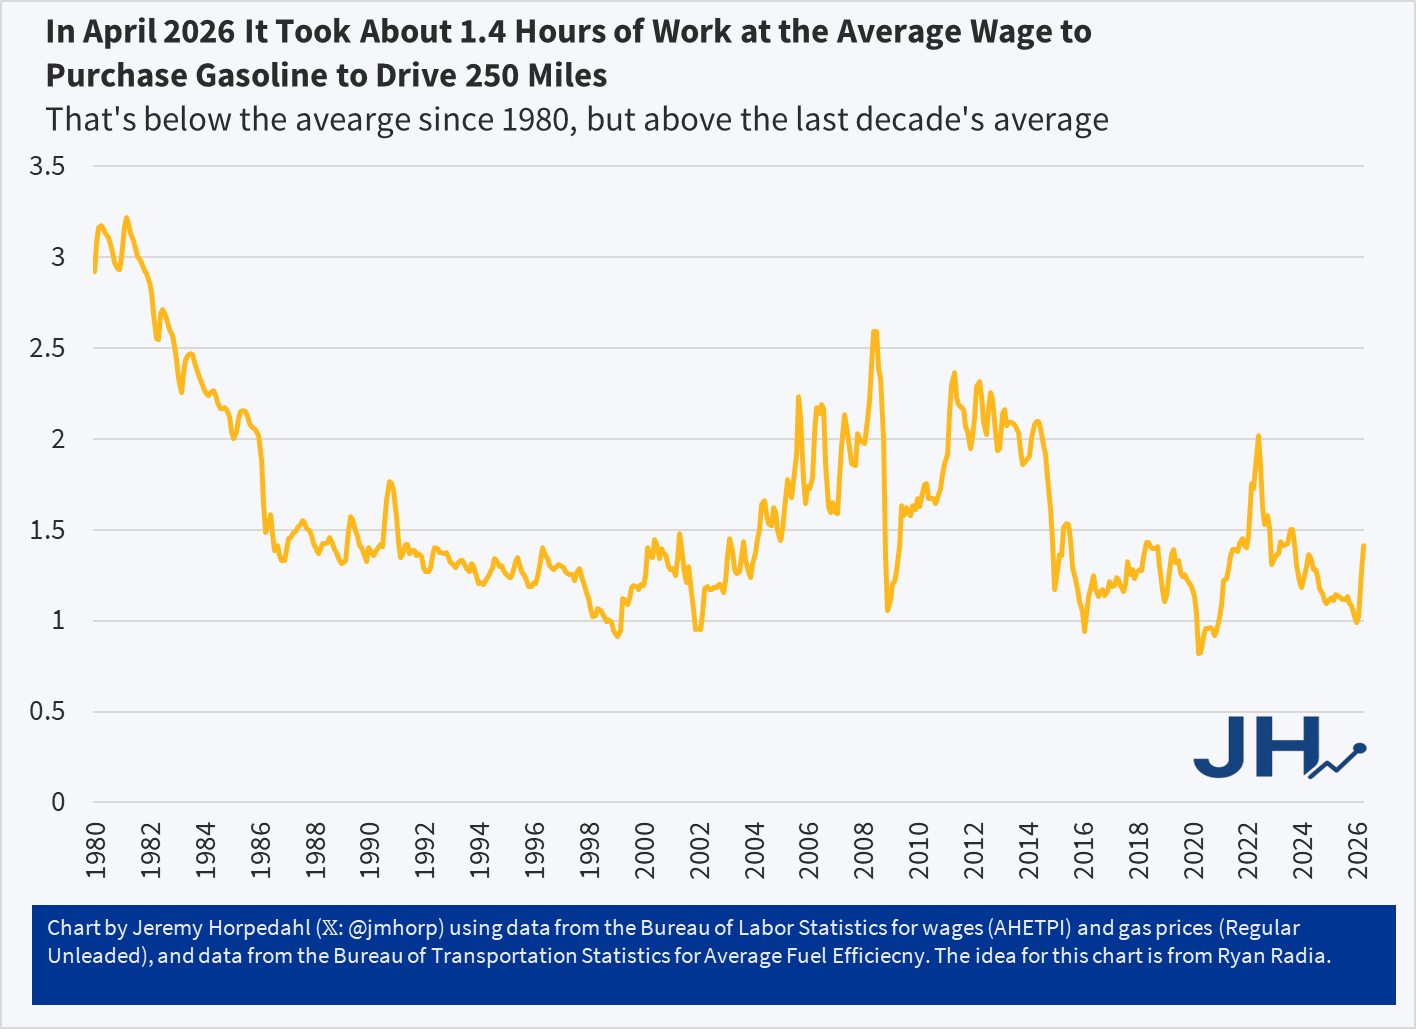
In April 2026 it took about 1.4 hours of work at the average wage ($32.23) to purchase enough gasoline to drive 250 miles (10.7 gallons) at the average fuel efficiency (23.4 miles per gallon). That average fuel efficiency figure is from 2024, the latest available, so it could be a bit higher today. Maybe it’s a little easier than 1.4 hours of work to buy it, but even if fuel efficiency had crept up to 25 mpg (that would be a big increase in 2 years, historically speaking), it would still be 1.3 hours of work.
1.4 hours of work is certainly a big jump from earlier in 2026, but you’ll notice it is still on the low end in this chart, and well below the peak we saw in June 2022 of just over 2 hours of work to buy 250 miles worth of gasoline.
But 23.4 miles per gallon is pretty low, as this is includes lots of trucks and SUVs with pretty bad fuel efficiency. What if we looked at some more fuel efficient vehicles?
Here’s a few I checked on (all for 2026 models, with gas and electricity at current national averages):
- Toyota Camry: 0.71 hours of work
- Chrysler Pacifica Hybrid: 0.61 hours on electric, 1.18 hours on gasoline
- Tesla Model Y: 0.37 hours of work
It will probably not surprise you that the all-electric Tesla Model Y is cheaper than the average car to operate at current prices, but you may not have realized that it is almost four times cheaper. But the Toyota Camry, with all models operating as hybrids now, also comes in pretty good at about half the cost of the average vehicle to operate (and the Camry is a very affordable car to purchase). The Chrysler Pacifica hybrid minivan does pretty well too, though even operating only on electricity (30 miles at a time), it’s only slightly more fuel efficient than the Camry.