I just published a paper on CON laws and spending in Contemporary Economic Policy. As frequent readers of this blog will know, CON laws in 34 states require healthcare providers in 34 US states to get permission from a state board before opening or expanding, and one goal of the laws is to reduce health care spending. The contribution we aim for in this paper is to lay out a theoretical framework for how these laws affect spending.
There have been many empirical papers on this, typically finding that CON laws increase spending, but the only theory explaining why has been simple supply and demand. Health care markets are hard to model for a few reasons, but one big one is that most spending is done through insurers, so the price consumers pay is typically quite a bit lower than the price producers receive. This leads to “moral hazard”- i.e. overuse and overspending by consumers. Normally economists hate monopolies because they lead to underproduction, so in a market with overuse its fair to ask (as Hotelling did about nonrenewable resources)- could two market failures (moral hazard overuse and monopoly underuse) cancel each other out?
Back in April I wrote about GDP growth rates and inflation rates in G7 countries and the OECD broadly. James also wrote about a broader set of countries (182!) using these two measures. Since the economic scene is evolving so quickly, and we now have 6 more months of data, I wanted to provide an update on the US and our other large peer nations.
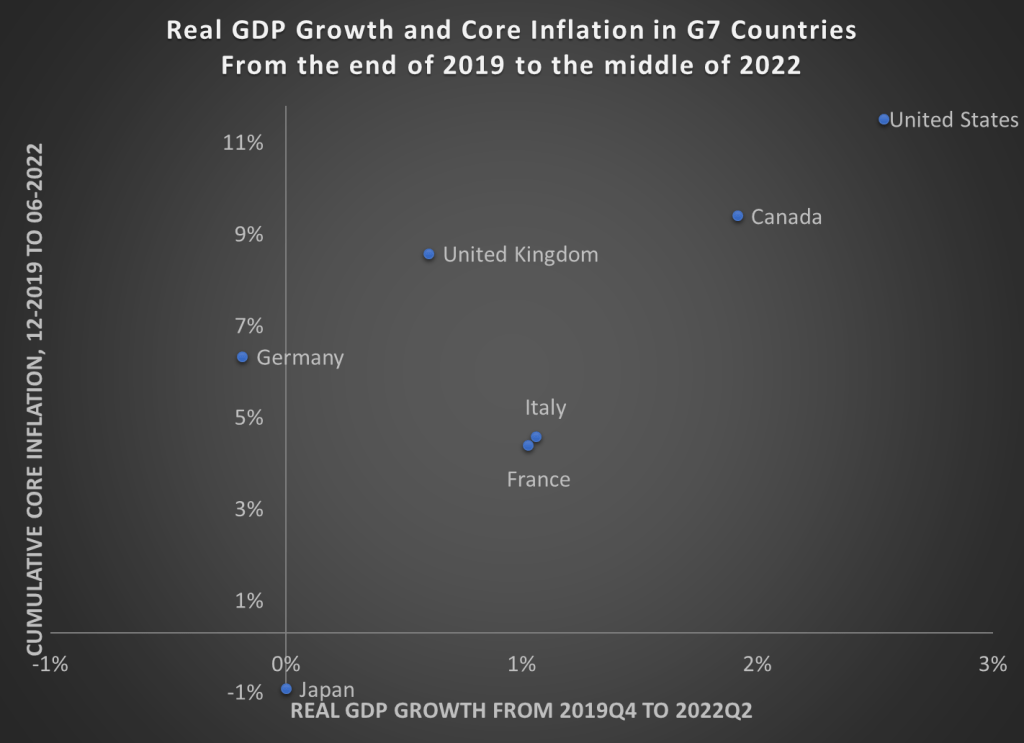
Here’s the data, showing cumulative real GDP growth and cumulative core inflation since the right before the pandemic (please note that I flipped the x- and y-axis from the previous post — sorry for the confusion, but this way makes more sense).
The picture looks roughly the same, but here are a few notable changes:
Despite the slight slowdown in GDP growth in the first half of 2022, the US still clearly has the highest rate of economic growth
UK, Italy, and Canada have now moved into positive territory for cumulative economic growth (yes, it’s all inflation adjusted)
But Japan and Germany still have had no net economic growth during the pandemic — and even worse for Germany, they have had a healthy dose of inflation too
The US once again stands out as having both the best economic performance and the worst inflation performance in the G7. Are these two things connected? That’s a question that is unanswerable from a simple scatterplot, and may be unanswerable completely. But I think it’s fair to say that the US hasn’t taken an obviously inferior economic path relative to other countries, even if our path has been inferior compared to some ideal policy. But don’t commit the Nirvana Fallacy!
Finally, we should recognize that the GDP is not the only important measure of how an economic is performing. For example, the US labor market has not recovered as well as some other peer nations have. Still, GDP is one of the important broad measures to look at, even if it is not ideal for diagnosing recessions.
In a world where China and India continue to build huge, CO2-belching coal power plants, and a world where global supply chains can no longer be taken for granted, you might think that a small, crowded country like the Netherlands would prioritize home-grown food production over concerns about greenhouse gas emissions from a relatively small volume of cow manure. But this is Europe, the land of eco-utopianism, and so you would be wrong.
Cow poop does emit nitrous oxide (a greenhouse gas) and ammonia (which can potentially pollute local water if uncontained). In a burst of green virtue, the Netherlands has, “unveiled a world-leading target to halve emissions of the gasses, as well as other nitrogen compounds that come from fertilizers, by 2030, to tackle their environmental and climate impacts.” This target is expected to result in a 30% reduction in livestock numbers and the closure of many farms. Dutch farmers are not amused, and have vented their ire by dumping hay bales on highways and smearing manure outside the home of the agricultural minister. Protests over green policies hobbling local farmers have spread to Germany and Canada.
All this raised in my mind the question, could we really get along with using much less nitrogen-based fertilizers? I found a great article by Hannah Ritchie on OurWorldinData.org, “Can we reduce fertilizer use without sacrificing food production?”, which provides lush tables and graphs on the subject.
First, it’s estimated that artificial nitrogen fertilizers (where hydrogen, mainly derived from natural gas, is reacted with atmospheric nitrogen at high pressure over catalysts to make ammonia and derivatives) allow the world’s population to be about twice as high is it would be otherwise. Put another way, take away nitrogen fertilizers, and half of us die. So any campaign to massively scale back on fertilizer usage would result in mass starvation. You first…
That said, Ritchie’s article pointed out that some countries such as China seem to be (inefficiently) using much more fertilizer than they need to get similar results, some countries (e.g. America) seem to be about in balance, and some areas (e.g. sub-Saharan Africa) would benefit from using more fertilizer. So globally we could probably use a bit less fertilizer if the profligate countries used (a lot) less, while the deprived countries used a little more.
I’ll conclude with two charts from Ritchie’s article. The first chart shows, for instance, that Brazil uses twice as much fertilizer per hectare or per acre as the U.S, and China uses three times as much, while Ghana uses about a tenth as much.
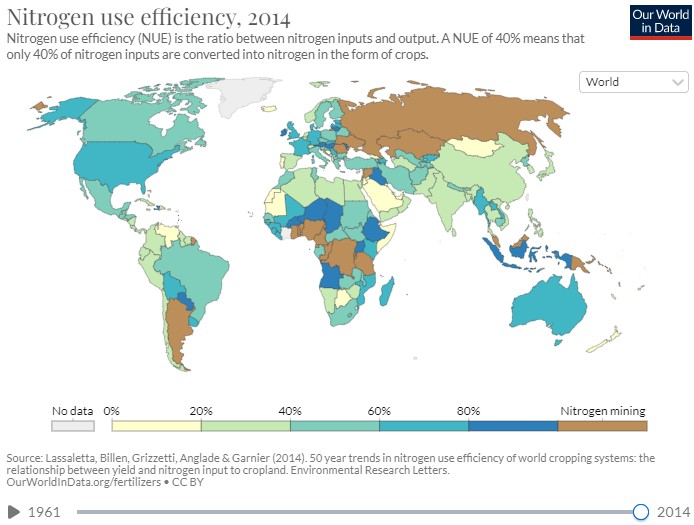
The second chart shows estimated nitrogen use efficiency (NUE). An NUE of 40%, for instance, shows that 40% of the nitrogen in the fertilizer is converted to nitrogen in the form of crops, while the other 60% of the nitrogen becomes pollutants. In China and India, only about a third of the applied nitrogen is fully utilized, compared to two thirds in places like the U.S. and France. ( Some countries have a very high NUE – greater than 100%. This means they are undersupplying nitrogen, but continue to try to grow more and more crops. Instead of utilizing readily available nutrients, crops have to take nitrogen from the soil. Over time this depletes soils of their nutrients which will be bad for crop production in the long-run).
You can download my full paper “If Wages Fell During a Recession” with Dan Houser from the Journal of Economic Behavior and Organization (only free until September 24, 2022).
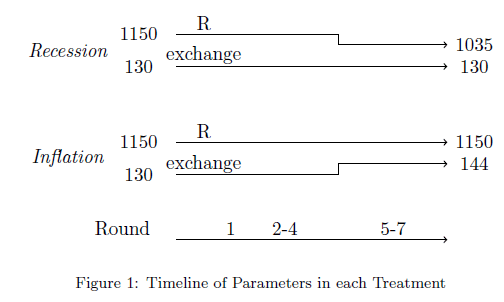
There is a simulated recession in our experiment. We ask what happens if employers cut wages in response. Although nominal wage cuts are rare in the outside world, some of our lab subjects cut the wages of their “employee”. Employees retaliated against nominal wage cuts by shirking, such that the employers probably would have been better off keeping wages rigid.
We also tried the same thing with an inflation shock that allowed the employer to institute a real wage cut without a nominal wage cut. The reaction to that real wage cut was muted compared to the retaliation against the obvious nominal wage cut.
Inflation was implemented after 3 rounds of the same wage to create a reference point.
The Great Recession happened when I was an undergraduate. As I started my career in research, the issue of employment and recessions seemed like THE problem to work on. The economy of 2022 is so different from the years that inspired this experiment! Below I’ll highlight current events and work from others on this topic.
Inflation used to be something Americans could almost ignore, and now it’s at the highest level I have seen in my lifetime. Suddenly, people are so mad about inflation that politicians named their bill the Inflation Reduction Act just to make it popular.
The EWED crew has made lots of good posts on inflation. Although job openings and (nominal) wage increases are noticeable right now, Jeremy explored whether inflation has wiped out apparent wage growth.
More recently, the WSJ reports that real wages are down because inflation is so high. “Wage gains haven’t kept pace with inflation. Private-sector wages and salaries declined 3.1% in the second quarter from a year earlier, when accounting for inflation.”
Firms in 2022 did not just sit back and let real wages get eroded exactly proportional to inflation. But it is also not the case that Americans got a raise of 9% to exactly offset inflation. According to our experiment, there would be outrage if workers were experiencing a nominal wage cut in proportion to the real wage cut they are getting right now.
The high inflation combined with a hot job market makes this current economy hard to compare to anything in our recent history. Brian at Price Theory explained that inflation pressure is coming from both supply and demand factors.
Political betting has long been in a legal grey area. It seems that the Commodities Futures Trading Commission wants to make everything black and white, but at least for now it has simply made everything murkier.
PredictIt is the largest political betting site in the US; if you want to know who is likely to win an upcoming election, its the best place to find a quick answer. Prediction markets have two great virtues- they are usually right about what’s going to happen, and if they aren’t you can bet, making money and improving their accuracy at the same time.
PredictIt has operated since 2014 under a “no-action letter” from the CFTC. Effectively, the regulators told them “we’re not saying what you’re doing is definitely legal, but we know about it and have no plans to shut you down as long as you stick to the limits described in this letter”. But last week the CFTC withdrew their letter and ordered PredictIt to shut down by February 2023.
My first question was, why? Why shut them down now after 8 years when all their operations seem to be working as usual? The CFTC said only that “DMO has determined that Victoria University has not operated its market in compliance with the terms of the letter and as a result has withdrawn it”, but did not specify which of the terms PredictIt violated, leaving us to speculate. Did the scale simply get too big? Did they advertise too heavily? Did Victoria University, the official operator, let too much be handled by a for-profit subcontractor? Did some of their markets stray too far from the “binary option contracts concerning political election outcomes and economic indicators” they were authorized for?
PredictIt hasn’t been much clearer about what happened, simply putting a notice on their site. Their CEO did an interview on the Star Spangled Gamblers podcast where he said there was no one thing that triggered the CFTC but did mention “scope” as a concern- which I interpret to mean that they offered some types of markets the CFTC didn’t like, perhaps markets like “how many times will Donald Trump tweet this month”.
The other big question here is about PredictIt’s competitors. In 2021 it seemed like we were entering a golden age of real-money prediction markets, with crypto-based PolyMarket and economics-focused Kalshi joining PredictIt. I looked forward to seeing this competition play out in the marketplace, but it now seems like we’re headed toward a Kalshi-only monopoly where they win not by offering the product users like best, but by having the best relationship with regulators. Polymarket had offered markets without even a no-action letter, based on the crypto ethos of “better to ask forgiveness than permission”; this January the CFTC hit them with a $1.5 million fine and ordered them to stop serving US customers.
If the CFTC doesn’t reverse their decision to shut down PredictIt, then February 2023 will see a Kalshi monopoly. This has led to speculation that Kalshi is behind the attack on PredictIt; their cofounder issued this not-quite-a-denial. But it certainly looks bad for the CFTC that they are effectively giving a monopoly to the company that hires the most ex-CFTC members.
For now you can still bet on PredictIt or Kalshi (or even Polymarket if you’re outside the US). If you’d like to petition the CFTC about PredictIt you can do so here. It might actually work; while the CFTC’s recent actions certainly look cronyistic, they’ve been reasonable compared to other regulators. They’re giving PredictIt no fines and several months to wind down, and even Polymarket gets to keep serving non-US customers from US soil. I’d likely make different decisions if I were at CFTC but the ideal solution here is a change in the law itself, as we’ve seen recently in sports betting. Prediction markets are impressive generators and aggregators of information, and politics and policy are at least as valuable an application as sports. To go meta, suppose we want to know- will PredictIt survive past February? There’s a prediction market for that, and its currently saying they’ve got a 20% chance.
Three weeks I wrote a blog post about how economists define a recession. I pretty quickly brushed aside the “two consecutive quarters of declining GDP,” since this is not the definition that NBER uses. But since that post (and thanks to a similar blog post from the White House the day after mine), there has been an ongoing debate among economists on social media about how we define recessions. And some economists and others in the media have insisted that the “two quarters” rule is a useful rule of thumb that is often used in textbooks.
It is absolutely true that you can find this “two quarters” rule mentioned in some economics textbooks. Occasionally, it is even part of the definition of a recession. But to try and move this debate forward, I collected as many examples as I could find from recent introductory economics textbooks. I tried to stick with the most recent editions to see what current thinking on the topic is among textbook authors, though I will also say a little bit about a few older editions after showing the results of my search.
Undoubtedly, I have missed a few principles textbooks (there are a lot of them!) so if you have a recent edition that I didn’t include, please share it and I’ll update the post accordingly. I also tried to stick with textbooks published in the last decade, though I made an exception for Samuelson and Nordhaus (2010) since Samuelson is so important to the history of principles textbooks (and his definition has changed, which I’ll discuss below).
But here’s my data on the 17 recent principles textbooks that I’ve found so far (send me more if you have them!). Thanks to Ninos Malek for gathering many of these textbooks and to my Twitter followers for some pointers too.
Last month Eric Basmajian published “Why Demographics Matter More Than Anything (For The Long Term)” on the financial site Seeking Alpha. He predicts that that the developed world plus China face a future of low economic growth (regardless of policy machinations) due simply to demographics. His key points:
Demographics are the most important factor for long-term analysis.
The young and old age cohorts negatively impact economic growth.
The prime-age population (25-64) drives the bulk of economic activity.
The world’s major economies are suffering from lower population growth and an older population.
Over the long run, the world’s major economies will have worse economic growth, which will negatively impact pro-cyclical asset prices (like stocks).
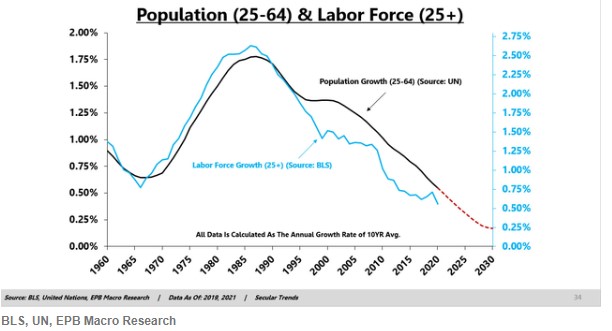
I will paste in some of his supporting charts. First, the labor force is more or less proportional to the 25-64 age cohort (U.S. data shown) :
…and GDP growth trends with labor force growth:
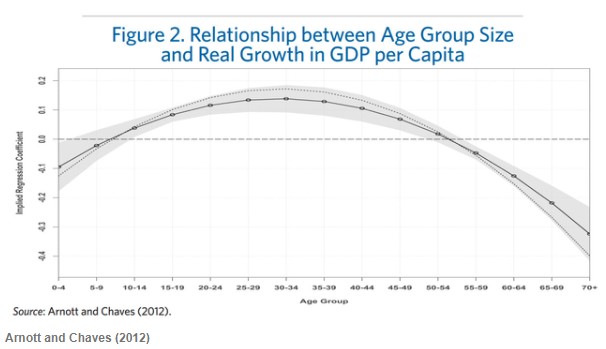
Also, on the consumption side, that is highest with the 25-54 age group:
And so,
Younger people are a drag on economic growth and older people are a drag on economic growth… The prime-age population is the segment that drives economic activity, so if the share of population that is 25-54 is shrinking, which it is, then you’re going to have more people that are a negative force than a positive force:
Once the working-age population growth flips negative, an economy is doomed…. Working age population growth in Japan flipped negative in the 1990s, and they moved to negative interest rates, QE, and they have never been able to stop. The economy is too weak.
After 2009, the working-age population in Europe flipped negative, and they moved to negative rates and QE, and they haven’t been able to stop. Even now, as the US is raising rates, Europe is struggling to catch up and has already abandoned most of its tightening plans.
In 2015, China’s working-age population flipped negative, and they’ve had problems ever since. They devalued their currency in 2015 and tried one more time to inflate a property bubble, but it didn’t work, and now they’re having to manage the deflation of an asset bubble that the population cannot support.
The US is in better shape than everyone else, but we’re not looking at robust growth levels in this prime-age population.
In conclusion, “ The real growth rate in most developed nations is collapsing because of those two factors, worsening demographics, and increased debt burdens. In the US, as a result of the demographic trends I just outlined plus a rising debt burden, real GDP per capita can barely sustain 1% increases over the long run compared to 2.5% in the 60s, 70s, and 80s.”
That is pretty much where Basmajian leaves it. No actionable advice (besides subscribing to his financial newsletter). What isn’t addressed is whether productivity (production per worker) can somehow be accelerated. Also, one of his charts (which I did not copy here) showed a big trend down in 25-64 age fraction in the US population in the 1950’s-1960’s (as hangover from the Depression?), and yet these were decades of strong GDP growth. So these demographic trends are not the whole story, but his analysis is sobering.
Science keeps getting bigger- more researchers, more funding, and of course more publications. Scientific progress is much harder to measure, but there are good arguments that it’s roughly flat over time. This implies that productivity per researcher is plummeting.
There’s been a lively debate about what drives this falling productivity- is it that the easy discoveries got made first, leaving only harder ones for today’s scientists? Or is something else tanking scientific productivity, like the bureaucratic way we organize scientific research today?
A recent paper, “Slowed canonical progress in large fields of science“, suggests that the growth in the number of researchers and publications could itself be part of the problem. Comparing scientific fields over time, they find that:
When the number of papers published per year in a scientific field grows large, citations flow disproportionately to already well-cited papers; the list of most-cited papers ossifies; new papers are unlikely to ever become highly cited, and when they do, it is not through a gradual, cumulative process of attention gathering; and newly published papers become unlikely to disrupt existing work. These findings suggest that the progress of large scientific fields may be slowed, trapped in existing canon.
What is driving this? They argue:
First, when many papers are published within a short period of time, scholars are forced to resort to heuristics to make continued sense of the field. Rather than encountering and considering intriguing new ideas each on their own merits, cognitively overloaded reviewers and readers process new work only in relationship to existing exemplars. A novel idea that does not fit within extant schemas will be less likely to be published, read, or cited. Faced with this dynamic, authors are pushed to frame their work firmly in relationship to well-known papers, which serve as “intellectual badges” identifying how the new work is to be understood, and discouraged from working on too-novel ideas that cannot be easily related to existing canon. The probabilities of a breakthrough novel idea being produced, published, and widely read all decline, and indeed, the publication of each new paper adds disproportionately to the citations for the already most-cited papers.
Second, if the arrival rate of new ideas is too fast, competition among new ideas may prevent any of the new ideas from becoming known and accepted field wide.
Supposing they are correct, it’s not totally clear what to do. At the biggest level we could fund fewer researchers in large fields, or push more fields to be like economics, where the quality of each researcher’s publications is valued much more than the quantity. But what can an individual researcher do differently? One idea is “boutique science” or “hipster science”, trying to find the smallest or newest field you could reasonably attach yourself to.
Another idea is that the role of generalists and synthesizers is becoming more valuable, as Tyler Cowen often says and David Esptein applies to science in his book Range. When papers are coming out faster than anyone can read, we need more people to sift through them and explain which few are actually important and which are forgettable or wrong. There are lots of ways to do this- review articles, meta-analysis, replication at scale, and of course blogs. But the junk pile is going to keep growing, so we’ll need new and better ways of finding the hidden gems.
US GDP fell for the second straight quarter according to statistics released this week by the Bureau of Economic Analysis. This means that by one common definition we’re now in a recession, which has ignited a debate about whether “two consecutive quarters of negative GDP growth” is the best definition (as opposed to ‘when the NBER says there’s one’, like I generally teach and Jeremy argued for here, or something else).
Naturally this debate has political overtones, since the party in power would be blamed for a recession, so we’ve seen the White House CEA argue that we’re not in a recession, many on the other side argue that we are, and plentiful hypocrisy from people who should know better.
But in political terms, the fight over the binary “are we in a recession” call won’t be the big economic factor in November’s elections- that will be inflation and GDP, especially 3rd quarter GDP. One of the oldest and best predictors of US elections is the Fair Model, which uses inflation and the number of recent “strong growth quarters”. Fair’s update following the recent Q2 GDP announcement states:
the predicted vote share for the Democrats is 46.70, which compares to 48.99 in October. The smaller predicted vote share for the Democrats is due to two fewer strong growth quarters and slightly higher inflation
By Election Day we’ll have 3 more months of economic data making it clear whether inflation is getting under control and whether economic activity is picking back up or continuing to decline. Monthly data releases on inflation and unemployment will be closely watched, but the most discussed release will likely be third quarter GDP. It will summarize 3 months instead of just one, it will be of huge relevance to the debate over how severe the recession is or whether we’re even in one, and it will likely be released less than two weeks before election day. The NBER almost certainly won’t weigh in by then; they tend to take over a year to date recessions, not adjudicate debates in real time.
So when BEA does release their Q3 GDP estimate in late October, what will it say? Markets currently estimate at least a 75% chance it will be positive (they had estimated a 36% chance of positive Q2 GDP just before the latest announcement). That sounds high to me, the yield curve is still inverted and I bet investment will continue to drag, but forecasting exact GDP numbers is hard. Its a much easier bet that whatever the number turns out to be will loom large in political debates just before the elections. Perhaps we’ll get the Q3 GDP growth number that would make for the most chaotic debate: 0.0%.
I heard on a radio interview that spending by the bottom quartile is way down in 2022, while it is holding up merrily for the upper two quartiles. My mind jumped to the thesis:
“Hmm, the bottom quartile probably (proportionately) felt the benefit of the three COVID stimulus packages more, plus they would have benefited more, proportionately, from the enhanced 2020-2021 unemployment benefits, which (I gathered from anecdotal observations) often paid them more for staying home than they used to receive for working. But…by 2022, all that extra money may be running out.”
I spent some time poking around the internet, trying to find some pre-made figures or tables to support or disprove this thesis. What I found tended to support it, but this is not rigorous data-mining. So, for what it is worth, here are some charts.
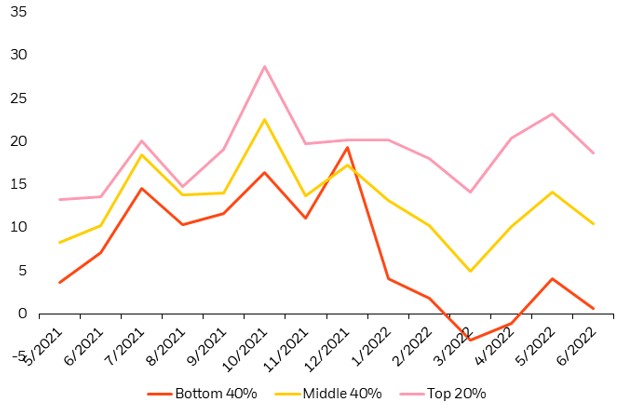
First, about the spending in 2022. This chart indicates that discretionary service spending by the bottom 40% income cohort is indeed down sharply in 2022, and now sits a little lower than a year ago, while the upper 20% cohort is spending actually more than a year ago. Spending by the middle 40% trended up in 2H 2021, then back down in 1H 2022, to end about even over the past 12 months:
Discretionary service consumption by income cohort. (I don’t what the units are for the y-axis, but presumably they show the trends). Source: Earnest Research, as of June 30, 2022, as reproduced by Blackrock.
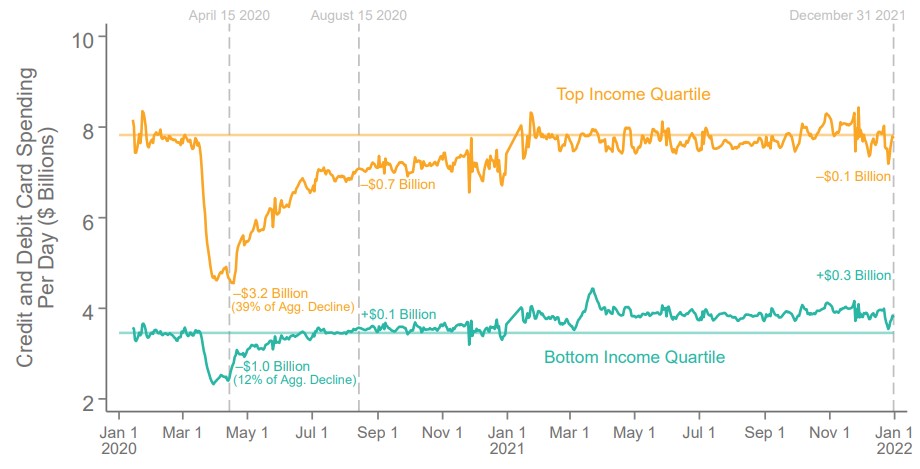
And what about 2020-2021? The next two charts indicate (a) that consumer spending was HIGHER in 2021 that it was pre-COVID for the bottom income quartile, even though (b) their employment in 2021 remained some 20% LOWER than pre-COVID. Looks to me like a lot of spending of stimmie checks was going on in 2021, but (see above) that money has run out in 2022.
Some reader here may have access to a more consistent data set, so I am happy to see this thesis tested further.