Inflation is Here. Why? What Can We Do?

The latest CPI release today shows that real inflation is here. Headline inflation for consumer prices is up 6.2% compared to a year ago and a almost full percentage point in just the past month (seasonally adjusted, so compared to the normal monthly increase).

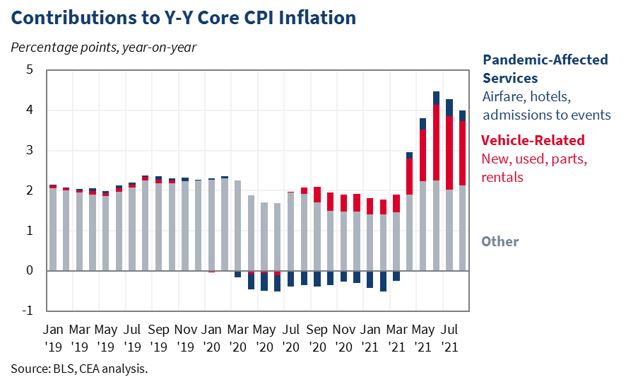
Back in June, we could reasonably say that 45% of the increase that month (and 27% over the prior year) had been due to just the price of new and used cars, in the past month only 17% can be attributed to vehicle prices. That’s still a lot, considering cars are only about 8 percent of the overall CPI, but inflation is clearly showing up in other areas.

Gasoline prices (also car related!) are always volatile, but they are up sharply in the past year. The over 50% increase for regular unleaded gasoline translates to $1.22 more per gallon than a year ago (and $1.50 more gallon than Spring 2020), which is the largest nominal price increase consumers have seen in a 12-month period (the data stretches back to 1977).

But gasoline is only about 4 percent of consumer spending. What if we look more broadly? Even excluding energy prices, inflation is 4.7% over the past year, the highest increase since 1991.

The natural related questions are Why? And what can we do about it?

The Why question is tricky. The Federal Reserve is very interested in whether the increase in prices is caused by monetary policy. It very much guides their action. Consumers don’t really care that much. They just want the pain to stop. Unfortunately, though, part of the pain may be induced by consumers themselves: spending on goods is extremely high right now, with the year so far 18% above the comparable period in 2019. Higher spending will increase prices in any environment, but the strain it is putting on supply chains only exacerbates the problem. This is not to “blame the victim,” but rather to understand what is going on.

What can be done? That’s an even harder question. It’s convenient to blame the President for things like gas prices. And certainly many voters and pundits will blame him. This charge is not completely without basis, as there are certainly things at the margin a president could do to ease gas prices in the short run (allow more drilling, gas tax hiatus), but we shouldn’t oversell this. And in other areas too, perhaps there are changes that could be made at the margin. But given the massive increases in consumer spending (at least for now), any changes won’t put a dent in the overall inflation rate.

But what about at the individual level? Milton Friedman was asked this question in 1980. That year inflation was 13.5%, the highest since World War II. Friedman’s answer: high living. He said there is no asset which you can expect to protect you against inflation, so you should spend what you have now on something nice. Buy a nice house, a nice suit, a picture to hang on the wall. This is what economists sometimes call “the flight to real values,” or as Phil Donahue put it “convert your money into material things.” While this advice may make sense at the individual level, it doesn’t have great implications for the current supply chain issues.

Friedman did have clear advice for the nation: the Federal Reserve should stop increasing the money supply. Whether that advice will work in the current environment, or whether it will stall the economic recovery, is the hard question the Fed is wrestling with at this very moment.

COVID and The Young

The CDC just approved vaccines from Americans aged 5-11. That’s great news! But today, I want to talk about another age group: mine.

A few months ago I wrote a post summarizing data for COVID-19 deaths among people in their 30s and 40s. While we have primarily thought of COVID as a disease impacting the elderly (and indeed in the aggregate, it is), there have been major health consequences for those under 65 too. Including major health consequences for the age group 30-49 (which I believe is the age range of all our bloggers here at EWED).

I wanted to update that data because a few new things have come to light. First, I highly recommend reading a recent paper by my friend Julian Reif and co-authors. They estimate the number of Years of Life Lost and Quality-Adjusted Years of Life Lost for different age groups from COVID-19. Their data runs through mid-March 2021, so before vaccines probably had much of a chance to impact the aggregate death numbers (though vaccines were being rolled out at the time).

Here’s their main result: while most of the deaths from COVID were among those aged 65 and older (80% through March 2021), most of the life lost in terms of years was for Americans under 65 (54% of QALYs). And even for very young adults, the risk in terms of years of life lost was not minimal. A comparison from the paper: “Adults aged 85 years or older faced 70 times more excess risk for death than those aged 25 to 34 years but only 3.9 times more individualized loss of QALYs per capita.” Compared to the 35-44 age group, the relevant factor is 2.8 times more individualized loss for the 85+ group.

It’s a great paper, but it only goes through March. What has happened since March 2021? While 80% of the COVID deaths up through March 2021 were among the elderly (65 and older), since April 2021 only 60% of the COVID deaths have been among the elderly. Part of this is because deaths are down among the elderly, but it’s also because deaths are up for the non-elderly. The table is my attempt to show this effect, looking at the period from March-September in both 2020 and 2021 (data is current as of October 27, so the September 2021 data is still not complete, but instructive).

For the oldest Americans, COVID deaths fell by 50%. That’s great! But for younger Americans, COVID deaths roughly doubled. Not good!

Continue reading

Growing/Shrinking Jobs of Next Decade: Good Times Ahead for Nurse Practitioners, Wind Turbine Technicians, and Animal Trainers

The good folks at Visual Capitalist have put together a big juicy infographic depicting employment trends over the next decade, based on projections from the Bureau of Labor Statistics. The vertical axis is % decadal growth for each category, the horizontal axis is 2020 median annual wage for that category, and the size of the bubble indicates the absolute numbers of change. The color of each bubble is keyed to “Occupational Group”, i.e.,  “Health related”, “Computer and mathematical”, etc.

Below I snipped part of the infographic which shows occupations which will be growing. The horizontal positioning (median annual wage) runs from $20,000 on the left to $120,000 on the far right; nurse practitioners fall in the $105,000-120,000 range. The fastest growing, percentagewise, are wind turbine service technicians (68%), followed by nurse practitioners and solar installers tied at about 52%. The biggest absolute numbers of job growth are in “Home health and personal care aides”, to tend aging baby boomers.

From the color coding, we can see at a glance that job growth is mainly in the Health Related and Computer and Mathematical categories, with a smattering of “Other”, including Animal Trainers (for dog obedience schools ??) and Crematory Operators, as those baby boomers age all the way out.

Some of the losing professions are shown below. Most of these are in the “Office and Admin Support” (purple) category and Production workers (including nuclear power reactor operators). Some “Other” categories will get hit hard, such as parking officers and door-to-door salesmen.

Most of these shrinking jobs are lower paid, while many of the growing jobs are better paid. Bottom line: advise your kids to consider careers like data security/analysis, or a health care specialty, including management.

Racial Gaps and Data Gaps

Are there racial gaps in the distribution of the COVID-19 vaccine? This is an important and interesting question in its own right. But I’ll talk about this question today because it’s an interesting example of how confusing and sometimes misleading data can be.

How do we answer this question? One is by surveying people. There are a number of surveys that ask this question, but a recent one by the Kaiser Family Foundation finds that among adults 70% of Blacks and 71% of Whites report being vaccinated. And given the sampling error possible with surveys, we would say that these are virtually identical. No racial gap! (Note: there was a racial gap when they did the same survey back in April, with 66% of Whites and 59% of Blacks vaccinated.)

But, surveys are just a sample, and perhaps people are lying. Maybe we shouldn’t trust surveys! And shouldn’t there be hard data on vaccines? Indeed, the CDC does publish data on vaccinations by race. That data shows a fairly large gap: 42.3% of Whites and only 36.6% of Blacks vaccinated. This is for at least one dose, and the percentages are of the total population (which is why it’s lower than the survey data). So maybe there is a racial gap after all!

But wait, if you look closely at the footnotes (always read the footnotes!), you’ll see something curious: the CDC admits that the race data are only available for 65.8% of the data. We don’t have the race information for over one-third of those in this data. Yikes! And given the exist disparities we know about in terms of income and access to healthcare, we might suspect that the errors are not randomly distributed. In other words, if there is probably good reason to suspect that Blacks are disproportionately reflected in the “unknown” category. But we just don’t know.

So what can we do? Since this data comes from US states, we can look at the individual state data and see if perhaps some of it is better (fewer unknowns). What does that data show us?

Continue reading

Clemens and Strain on Large and Small Minimum Wage Changes

In my Labor Economics class, I do a lecture on empirical work and the minimum wage, starting with Card & Kreuger (1993). I’m going to quickly tack on the new working paper by Clemens & Strain “The Heterogeneous Effects of Large and Small Minimum Wage Changes: Evidence over the Short and Medium Run Using a Pre-Analysis Plan”.

The results, as summarized in the second half of their abstract are:

relatively large minimum wage increases reduced employment rates among low-skilled individuals by just over 2.5 percentage points. Our estimates of the effects of relatively small minimum wage increases vary across data sets and specifications but are, on average, both economically and statistically indistinguishable from zero. We estimate that medium-run effects exceed short-run effects and that the elasticity of employment with respect to the minimum wage is substantially more negative for large minimum wage increases than for small increases.

The variation in the data comes from choices by states to raise the minimum wage.

A number of states legislated and began to enact minimum wage changes that varied substantially in their magnitude. … The past decade thus provided a suitable opportunity to study the medium-run effects of both moderate minimum wage changes and historically large minimum wage changes.

We divide states into four groups designed to track several plausibly relevant differences in their minimum wage regimes. The first group consists of states that enacted no minimum wage changes between January 2013 and the later years of our sample. The second group consists of states that enacted minimum wage changes due to prior legislation that calls for indexing the minimum wage for inflation. The third and fourth groups consist of states that have enacted minimum wage changes through relatively recent legislation. We divide the latter set of states into two groups based on the size of their minimum wage changes and based on how early in our sample they passed the underlying legislation.

The “large” increase group includes states that enacted considerable change. New York and California “have legislated pathways to a $15 minimum wage, the full increase to which firms are responding exceed 60 log points in total.” Data comes from the American Community Survey (ACS) and the Current Population Survey (CPS).

Continue reading

Human Capital and Filepaths

Someone wrote a story about my life. It’s a report from The Verge called “File Not Found: A generation that grew up with Google is forcing professors to rethink their lesson plans”.

When I started teaching an advanced data analytics class to undergraduates in 2017, I noticed that some of them did not know how to locate files on a PC. Something that is unavoidable in data analytics is getting software to access data from a storage device. It’s not “programming” nor is it “predictive analytics”, but you can’t get far without it. You need to know what directory to point the software to, meaning that you need to know what directory contains the data file.

As the article says

the concept of file folders and directories, essential to previous generations’ understanding of computers, is gibberish to many modern students. It’s the idea that a modern computer doesn’t just save a file in an infinite expanse; it saves it in the “Downloads” folder, the “Desktop” folder, or the “Documents” folder, all of which live within “This PC,” and each of which might have folders nested within them, too. It’s an idea that’s likely intuitive to any computer user who remembers the floppy disk.

I am a long-time PC user. Navigating File Explorer is about as instinctive as drinking a glass of water for me. The so-called digital natives of Gen Z have been glued to mobile device screens that shield them from learning anything about computers.

Not everyone needs to know how computers work. I myself only know the layer that I was forced to learn.

My Dad, to whom I owe so much, kept a Commodore 64 in a closet in our house. About once a year, he would try to entice me into learning how to use it. I remember screwing up my 9-year-old eyes and trying to care. Care, I could not. It’s hard to force yourself to do extra work without a clear goal. The Verge article explains

But it may also be that in an age where every conceivable user interface includes a search function, young people have never needed folders or directories for the tasks they do. The first internet search engines were used around 1990, but features like Windows Search and Spotlight on macOS are both products of the early 2000s. Most of 2017’s college freshmen were born in the very late ‘90s. They were in elementary school when the iPhone debuted; they’re around the same age as Google. While many of today’s professors grew up without search functions on their phones and computers, today’s students increasingly don’t remember a world without them.

One area in which I do minimum archiving is my email. I rely heavily on the search function. I could spend time creating email folders, but I’m not going to put in the time unless I’m forced to.

Here’s where the “problem” lies:

The primary issue is that the code researchers write, run at the command line, needs to be told exactly how to access the files it’s working with — it can’t search for those files on its own. Some programming languages have search functions, but they’re difficult to implement and not commonly used. It’s in the programming lessons where STEM professors, across fields, are encountering problems.

Regardless of source, the consequence is clear. STEM educators are increasingly taking on dual roles: those of instructors not only in their field of expertise but in computer fundamentals as well.

Personally, I don’t mind taking on that dual role. I didn’t learn to program until I really wanted to. The only reason I wanted to was that I had discovered economics. I wanted to be able to participate in social science research. Let these STEM or business courses be the motivation for students to learn to use computers as tools instead of just for entertainment.

Allen Downey wrote a great blog on this topic back in 2018 that is more practical for teachers than the Verge report. He argues that learning to program will be harder for the 20-year-olds of today than it was for “us” (old people as defined by entering college before 2016). He recommends a few practical strategies, while acknowledging that there is “pain” somewhere along the process. He thinks it is sometimes appropriate to delay that pain by using browser-based programming interfaces, in the beginning.

I gave my students a break from pain this week with a little in-browser game that you can play at https://www.brainpop.com/games/blocklymaze/ They got 10 minutes to forget about file paths, and then it was back to the hard work.

I have found that a lot of students need individual attention for this step – the finding a file in their hard drive. I only have to do that once per student. Students pick the system up quickly. File Explorer is a pretty user-friendly mechanism. Everyone just has to have a first time. Sometimes, Zoomers just need a real person who cares about them to come along and say, “The file you downloaded exists on this machine.”

One way around this problem is to reference data that lives on the internet instead of in a local machine. If you are working through the examples in Scott Cunningham’s new book Causal Inference, here’s a piece of the code he provides to import data from his public repository into R.

full_path <- paste(https://raw.github.com/scunning1975/mixtape/master/, df, sep=“”)

df <- read_dta(full_path)

The nice thing about referencing data that is freely available online is that the same line of code will work on every machine as long as the student is connected to the internet.

As more and more of life moves into the cloud, technologists might increasingly be pointing programs to a web address instead of the /Downloads folder on their local machine. Nevertheless, the kids need to have a better sense of where files are stored. He or she who can understand file architecture is going to get paid a lot more than their peers who only know who to poke and scroll on a smartphone.

There is a future scenario in which AI does most of the programming for us. When AI can fetch files for us, then File Explorer may seem obsolete. But I worry about a world in which fewer and fewer humans know where their information is stored.

Covid, Cars, China, Crypto, Corruption

We generally do long “effort posts” on specific topics here, but today I’m mixing things up with 5 quick updates.

  1. Covid My daughter got sent home with a cough Tuesday, which meant I cancelled classes Wednesday to hang out with her until we get a Covid-negative PCR. Last Thursday my son’s public school was closed for Yom Kippur, and I got so focused on hanging out with him I forgot to post here.
  2. Cars My wife bought a new used car last week. We’ve covered here how car prices have jumped up while inventories fell this summer, and the latest numbers show that used car prices are now falling slightly from very high levels while new car prices continue to rise. While actually buying a car, the low inventories stood out even more than the high prices. Several times we saw a promising car online, only to call or visit the dealer and find out it had sold the day before. The new Nissan Leaf sounds like an excellent value at its sticker price, but none were available in Rhode Island, and no blue ones anywhere in New England.
  3. China Scott covered the collapsing Chinese real estate market on Tuesday. I’ll just pass along the takes I’ve seen from Western economists and China-watchers Michael Pettis and Christopher Balding, which is that this is a big deal that will slow Chinese growth for years but is unlikely to precipitate a 2007-style financial crisis. I find Balding’s argument that financial contagion will be limited to be convincing partly because of his actual arguments about quasi-bailouts, and partly because he almost always argues that “things in China are worse than you think”, so if he says “Evergrande isn’t Lehman Brothers” I listen.
  4. Crypto Tuesday I met the co-founder of a new crypto-based prediction market, Melange, which sounds promising. The prediction market space is growing rapidly with PolyMarket and Kalshi joining the older PredictIt.
  5. Corruption Last week the World Bank announced it is discontinuing the Doing Business report/ranking due to apparent corruption; top Bank officials in the middle of raising money from countries including China pushed to raise the rankings of those countries beyond what the data justified. I hope another organization steps up do continue the good parts of the Doing Business report in a more trustworthy way.

Why Do We Care About Inflation?

The title question may seem obvious. “We” care about inflation because, ultimately, any dollars we have saved will purchase fewer real goods and services. Additionally, we might worry that our incomes are not keeping pace with the increase in the prices of good and services that we want to purchase.

But the answer to that question is a little more nuanced. “We” also care about why prices are increasing. I keep putting “we” in quotation marks because who the we is crucial for answering the question. For example, individuals and families primarily care about inflation for the reasons I stated in the first paragraph.

But central bankers care about inflation for different reasons. In broad terms, monetary policy is an attempt to smooth out the fluctuations in the economy, especially to make recessions shorter and less deep. But monetary officials want to know: is the policy they are putting in place leading to prices rising in general? If so, especially if inflation gets above certain target levels, it may mean that monetary has been “too loose.”

However, if particular prices are rising, say the price of cars (due to a lack of computer chips), central bankers don’t really care about this: it gives them no indication of whether they’ve done “too much” or “too little” with regards to stimulating the economy. Similarly, if gasoline prices rise, consumers really care about this. Central bankers, not so much: it doesn’t really tell them much about their goal (stimulating the economy with stimulating it too much).

And because some prices are so volatile, historical context is important for understanding what a recent increase or decrease means. For example, gasoline prices are up 45% in the past 12 months. That’s a lot! But it’s an increase from a very low base, and the historical reality is that gasoline prices today (around $3.00/gallon on average) are at similar levels to what they were way back in 2006, and are lower than they were for almost all of 2011-2014. And these are all in nominal terms, median household income has gone up a lot since 2006 (up 40% in nominal terms) and even since 2014 (up 25%).

All of this is important background for thinking about the latest release of the CPI-U data this week. The headline inflation number of 5.3% is indeed startling, similar to last month. We haven’t touched that level since mid-2008, and that was only for a few months. If consumer price inflation were to stay at around 5% for a sustained period of time, it would be a new, harsh reality for most consumers today: we haven’t had a year with 5% inflation since 1990, and for the past decade the average has hung around 2%.

So will it stay this high? Sadly, I have no crystal ball and I will just reiterate what I said last month: the picture is just too muddled right now to say anything concrete. Perhaps by the end of the year we will have a better picture. But is there anything we can say right now even with the muddled picture? I continue to like this chart from the Council of Economic Advisors:

Image

Bottom line: if we strip out the unusual supply chain disruptions to automobiles as well as airline/hotel prices making up for lost ground during the pandemic, inflation is at completely normal levels. It’s almost exactly 2%

But is this cheating? Can we really strip out the things that are increasing at rapid rates?

Continue reading

Why do Costa Ricans outlive Americans?

Which country in the Western Hemisphere has the longest life expectancy?

Unsurprisingly its Canada, at 82.2 years (pre-Covid).

But which country in the Americas comes in second?

Surprisingly, its Costa Rica at 80.8 years.

Source

The United States, by far the richest country in the Americas, had a life expectancy of 78.4 years that was falling even before Covid.

How is it that Costa Rica outperforms not only the much richer United States, but also other somewhat richer countries like Panama, Mexico, Argentina, and the Dominican Republic?

Clearly they don’t do it by outspending us- Costa Rica spends the equivalent of $1600 dollars per person per year on health care, compared to nearly $12000 in the US (7.3% of their GDP goes to health care vs 16.8% for the US).

Source

So what exactly is Costa Rica doing right? Atul Gawande tackles this question in his latest article for the New Yorker.

He argues that the key has been Costa Rica’s investment in primary care and public health. The US might may have many more of the world’s best (and most expensive) hospitals, but the easiest and cheapest health benefits come from keeping people out of hospitals in the first place.

the country has made public health—measures to improve the health of the population as a whole—central to the delivery of medical care. Even in countries with robust universal health care, public health is usually an add-on; the vast majority of spending goes to treat the ailments of individuals. In Costa Rica, though, public health has been a priority for decades.

In the nineteen-seventies, Costa Rica identified maternal and child mortality as its biggest source of lost years of life. The public-health units directed pregnant women to prenatal care and delivery in hospitals, where officials made sure that personnel were prepared to prevent and manage the most frequent dangers, such as maternal hemorrhage, newborn respiratory failure, and sepsis. Nutrition programs helped reduce food shortages and underweight births; sanitation and vaccination campaigns reduced infectious diseases, from cholera to diphtheria; and a network of primary-care clinics delivered better treatment for children who did fall sick. Clinics also provided better access to contraception; by 1990, the average family size had dropped to just over three children.

The strategy demonstrated rapid and dramatic results. In 1970, seven per cent of children died before their first birthday. By 1980, only two per cent did. In the course of the decade, maternal deaths fell by eighty per cent. The nation’s over-all life expectancy became the longest in Latin America, and kept growing. By 1985, Costa Rica’s life expectancy matched that of the United States.

Gawande goes on to describe how every Costa Rican gets a home visit from a health care worker at least once per year. This is quite the contrast to the US, where even getting primary care doctors to let you see them in their office can be a fight. I moved to Rhode Island last year and this week finally tried getting a primary care doctor here. I looked through the list of doctors covered by my insurance that my insurer said were accepting new patients and started making calls (by the way, why calls? do any doctors book appointments online?). 2 said that they actually weren’t taking new patients. 9 never answered the phone. The 12th doctor I tried, one farther away and lower-rated than I’d like, finally agreed to see me- in 3 months.

For anyone with less free time, determination, or insurance coverage, it would be natural to just give up after the 5th or the 10th “no”. Clearly many Americans do, leading manageable conditions like diabetes or high blood pressure to turn into acute health crises and expensive hospital visits.

I do think individual doctors could do better here by thinking through their appointment process from the patient’s perspective. But at its core this is simply a numbers issue- we don’t have enough primary care doctors to go around. We actually have fewer doctors per capita than Costa Rica, and relatively high share of specialists means that we have even fewer primary care doctors to go around. More medical school spots, more primary care residency spots, and fewer restrictions on immigrant doctors could go a long way way toward helping to US catch up to…. Costa Rica.

That, or their secret is just the volcanoes. This is surprisingly plausible- the US state with the longest life expectancy is also the one best known for volcanoes, Hawaii.

GDP Losses and COVID Deaths (6 month update)

Back in March of this year, I wrote blog posts providing data on GDP losses and COVID-19 deaths for 2020, both for selected countries and US states. Since we’ve now had another 6 months of GDP data and the pandemic continues to take lives, I thought it would be useful to update that data.

I will update the data for US states in a future post, but here is the most recent data for about 3 dozen countries (mostly European and North American countries, since they have the most believe COVID data).

*indicates that the GDP data is only through the first quarter of 2021
Continue reading