Between 1850 and 1910, most US censuses asked whether an individual was deaf. There were four alternative descriptions among the combinations of deafness and dumbness. Seems straightforward enough. The problem is that these aren’t discrete categories, they’re continuous. That is, one’s ability to hear can be zero, very good, bad, or just middling. What constitutes the threshold for deafness? In practice, it was the discretion of the enumerator. Understandably, there was a lot of variation in judgement from one enumerator to another. A lot of older people were categorized as deaf, even if they had some hearing loss.
Continue readingHistory
What is $100 from the Late Nineteenth Century Worth Today?
Recently I was watching a lecture by historian Marcus Witcher which addressed the treatment of African Americans in the Jim Crow era. Witcher mentioned the “pig laws,” which were severe legal punishments given to Blacks in the South for what used to be petty crimes. Such as stealing a pig. He mentioned that the fines could be anywhere from $100 to $500, and then he asked me directly: how much is $100 adjusted for inflation today?
My initial, immediate answer was about $3,000. That turns out to be almost exactly correct for around 1880. But the more I thought about it, the more I realized that this wasn’t a satisfactory answer. We were trying to put $100 from a distant past year in context to understand how much of a burden this was for African Americans at the time. Does knowing that adjusted for inflation it’s about $3,000 give us much context?
Continue readingLife Expectancy By State 1990-2019
I’m making a panel of historical life expectancy data by state available here:
Life Expectancy By State 1990-2019
It covers the years 1990 to 2019 for every US state, and has life expectancy at birth, age 25, and age 65. It includes breakdowns by sex and by race and ethnicity, though the race and ethnicity breakdowns aren’t available for every state and year.
This is one of those things that you’d think would be easy to find elsewhere, but isn’t. The CDC’s National Center for Health Statistics publishes state life expectancy data, but only makes it easily available back to 2018. The United States Mortality DataBase has state life expectancy data back to 1959, but makes it quite hard to use: it requires creating an account, uses opaque variable names, and puts the data for each state into a different spreadsheet, requiring users who want a state panel to merge 50 sheets. It also bans re-sharing the data, which is why the dataset I present here is based on IHME’s data instead.
The IHME data is much more user-friendly than the CDC or USMDB, but still has major issues. By including lots of extraneous information and arranging the data in an odd way, it has over 600,000 rows of data; covering 50 states over 30 years should only take about 1,500 rows, which is what I’ve cleaned and rearranged it to. IHME also never actually gives the most basic variable: life expectancy at birth by state. They only ever give separate life expectancies for men and women. I created overall life expectancy by state by averaging life expectancy for men and women. This gives people any easy number to use, but a simple average is not the ideal way to do this, since state populations aren’t exactly 50/50, particularly for 65 year olds. If you’re doing serious work on 65yo life expectancy you probably want to find a better way to do this, or just use the separate male/female variables. You might also consider sticking with the original IHME data (if its important to have population and all cause mortality by age, which I deleted as extraneous) or the United States Mortality DataBase (if you want pre-1990 data).
Overall though, my state life expectancy panel should provide a quick and easy option that works well for most people.
Here’s an example of what can be done with the data:

If states are on the red line, their life expectancy didn’t change from 1990 to 2019. If a state were below the red line, it would mean their life expectancy fell, which done did (some state names spill over the line, but the true data point is at the start of the name). The higher above the line a state is, the more the life expectancy increased from 1990 to 2019. So Oklahoma, Mississippi, West Virginia, Kentucky and North Dakota barely improved, gaining less than 1.5 years. On the other extreme Alaska, California, New York improved by more than 5 years; the biggest improvement was in DC, which gained a whopping 9.1 years of life expectancy over 30 years. My initial thought was that this was mainly driven by the changing racial composition of DC, but in fact it appears that the gains were broad based: black life expectancy rose from 65 to 72, while white life expectancy rose from 77 to 87.
You can find other improved datasets on my data page, and once again this life expectancy data is here: Life Expectancy By State 1990-2019
It’s Never Good News When Deposit Insurance is in the News
As you may have heard, there have been a few bank failures in the US in the past week. This has led ordinary people to start refreshing their memory about exactly what “deposit insurance” is and what it means for them. It has also led regulators, politicians, and economists to start refreshing their memory about the social purpose of deposit insurance, which is to stabilize the banking system. There are lots of aspects of the bank failures and deposit insurance to consider, but I think we can all agree that when ordinary people are thinking about this topic, bad things are going on.
While I can’t find a systematic survey of economists on this topic, my guess is that most economists would agree with the statement “on balance, deposit insurance promotes stability in the financial system.”
But there is a minority view, and one with (in my opinion) considerable historical support. Deposit insurance could potentially be destabilizing, since it has the potential (like any form of insurance) to create moral hazard. By lowering the cost of making mistakes, we would expect more mistakes. The cost need not be lowered all the way to zero for moral hazard to be a problem (bank owners still have some skin in the game), but the cost is certainly lower. These problems may be even more of a threat to the financial system than other areas of life covered by insurance.
That’s the theory. What’s the evidence?
My favorite paper on this topic is a 1990 article by Charles Calomiris called “Is Deposit Insurance Necessary? A Historical Perspective.” Not only does it conclude that deposit insurance isn’t necessary, but even more: it may be destabilizing. (You can also read a version of the article intended for a more general audience that Calomiris wrote for the Chicago Fed.)
Continue readingComplacency and American Girl Dolls 2
It’s time to revisit American Girl Dolls and the Saturn V rocket. The trending topic among millennials is the new “historical” American Girl doll who lives in the year 1999.
Previously, I blogged about the historical Courtney doll from 1986 in “Complacency and American Girl Dolls.” I used Courtney’s accessories to illustrate stagnation in the physical environment (within rich countries) of recent decades. Courtney has a Walkman for playing cassette tapes and she has an arcade-style Pac-Man game to entertain herself. I pointed out that ’80’s Courtney had to be given the World War II doll Molly just to keep life interesting.
What do Isabel and Nicki have a decade later in 1999?
They have a personal CD player and floppy disks. It’s cute and the toys will sell. However, it does not seem like innovation has introduced many new capabilities. Isabel can listen to music through her headphones and be entertained on screens, just like Courtney could.

Isabel eats Pizza Hut and has dial-up internet access. There is no sense of sacrifice or expanding the frontier. The world was settled, and history had ended.
What counts for adventure in 1999? Shopping vintage clothing. Just like Courtney, Isabel revisits the past to get a sense of purpose or excitement.

This is Isabel’s diary. Having nothing to do besides look at clothes from past decades, she obsesses over status. Presumably “Kat” complimented her hat in person. Facebook didn’t start until 2004, so Isabel is not worried about “Likes” in social media.
So, what did I do with my kids for their school break on Presidents’ Day? We went to the U.S. Space and Rocket Center to see the Saturn V rocket.
Continue readingYes, it was SMET
Last week I posted about the transition from SMET to STEM at the National Science Foundation. I was repeating a story that can be found on several websites including an entry in Britannica.
Andrew Ruapp reached out to me about a possible error in my post. He presented some evidence that the term STEM has been used prior to 2001. Casually Googling the topic did not bring me to a reputable source for the claim I had made last week. “SMET” is comically bad. So, I did start to wonder if it had never been officially used at the NSF and was just a funny story getting repeated online.
To solve this problem, I reached out directly to the person who was credited with making the transition. Dr. Judith Ramaley is currently President Emerita and Distinguished Professor of Public Service at Portland State University.
Having her permission to share, here is our email correspondence:

Encouraged by her reply, I looked online and found a public NSF document from 1998 that clearly uses SMET.
Lastly, I asked her several questions, in a mini email interview:
- Are you surprised by how widespread the STEM term has become?
Ramaley: I wasn’t surprised because once NSF adopted the new acronym, I expected it would catch on.
2. Do you feel that the “STEM” brand has been successful?
Ramaley: STEM isn’t really a brand. It is simply an acronym. It works better than SMET I think because engineering and technology are framed by science and mathematics rather than trailing along behind as if less important. I am fascinated by the growing pressure to add other elements to STEM, making it STEAM, for instance.
3. My son in 2nd grade goes to a STEM activity class once a week. (They just call it “STEM.”) This week he tells me they are working on a pollination project. Would you recommend anything different than the current system for encouraging American students to pursue technology fields?
Ramaley: Your third question is a sweeping one. It would help to know what a STEM activity means each week in your son’s second grade class. I am drawn to ways of learning STEM that encourage students to approach these issues in an inquiry-based way that lets them explore what it means to ask interesting questions and work out ways to try to answer them. Young people are very curious about how the world works. I doubt that I need to tell you that since I bet your son sometimes drives you nuts with WHY and HOW questions. Questions like that are beautiful questions.
Iterations of the Survivorship Bias Meme
If you are Online at all, you have probably seen the survivorship bias plane:

It has inspired new memes. They are funniest when posted without any explanation. Two recent examples are:
and
Sometimes the picture of the plane is used as a whole argument, without any words.
Continue readingThe Growth of Black Families Income
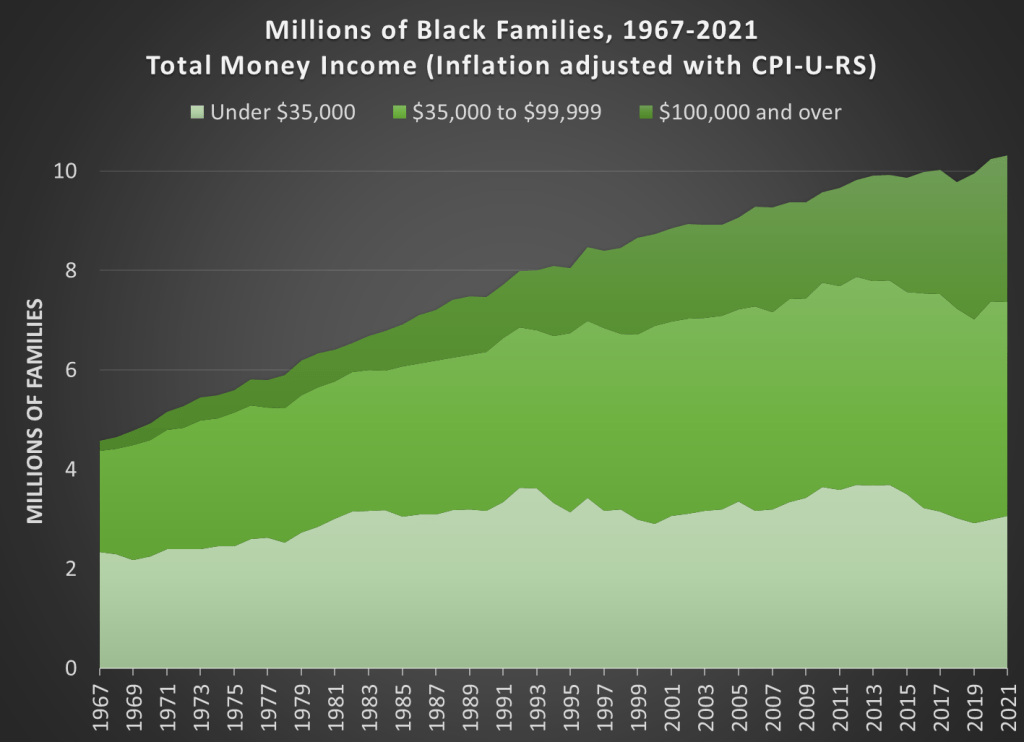
Black families are the poorest major racial or ethnic group in the US. With a median income of $59,541, a Black family only has about 59 percent of the income of a White, Non-Hispanic family. That’s the same proportion, 59 percent, as was true in 1972, the earliest date that we have comparable data. (For most of the data in this post, I will be using Table F-23 from the Census Bureau’s Historical Income Tables.) That’s almost 50 years with no closing of the racial gap in total money income for families.
Of course, what this also means is that family incomes of both Black and Whites grew at the same rate from 1972 to 2021. They both are about 50 percent larger than in 1972, and that’s after accounting for inflation (using the CPI-U-RS). As a first point of optimism, this very much goes against the typical narrative of income stagnation since the early 1970s.
To be sure, some of this growth is because families have more earners today, but even so: they have a lot more income. Having two earners does mean that you must spend more on some consumption categories, such as daycare when kids are young, possibly more on dining out or prepared meals. But even with those additional expenses, these families will have significantly more disposable income than their 1970s counterparts.
There is an ever more optimistic fact that we need to point out for Black families today: there are many, many more rich Black families today than in 1972. There are more rich families in absolute terms and as a proportion of the total. Here is the basic data from the Census Bureau (it goes back to 1967, the earliest date available for Blacks).
The Social Drug of Prohibition
Why does the average drinker consume alcohol? There are plenty of reasons, one of which is social. Alcohol, while inhibiting clarity, precision, and discretion, is a social lubricant. If you’re one of those drinking, then it’s enjoyable to be around other drinkers. Also, people build the habit of drinking *something* while socializing. We all know that prohibition resulted in bootlegging and tainted cocktails. But what were the legal alternatives? One was that you could purchase grape juice and make your own wine (that’s a story for another time). Another is to switch to another drug.
Alcohol is a depressant and arguably the most popular one in the US. It’s not a clear substitute for alcohol in terms of its direct effects on the body. However, it’s a liquid, safe, and tasty. That make is a good candidate for satisfying the physical urge to imbibe. But, importantly, it is also a social drug. People would get so hopped up on coffee and feed off of one another’s high that Charles the II of England banned coffee houses in order to prevent seditious fomentation. This brings us to an important characteristic of coffee. It’s a stimulant. You’d think that a stimulant would not be a substitute for alcohol. If anything, one might think that they are complements. Coffee helps to provide that kick in the pants after having an enjoyable night. But, the social feature makes coffee a good candidate to substitute alcohol, should the times be dire.
Illegal activity aside, people wanted an outlet for their physical and social proclivities. They wanted intoxication. Coffee provided exactly that. Conveniently, the continental US didn’t grow any of its own coffee. That means that imports and domestic consumption have a tight relationship.
Continue readingChesterton Views on Work in 20th Century America
One hundred years ago, the British writer G.K. Chesterton traveled to the United States for a lecture tour. He published his observations of America in What I Saw in America (1922). In an essay titled “The American Businessman”, Chesterton notes with surprise how passionate Americans appear about their professional work.
Chesterton recognizes this enthusiasm for work as more than mere greed.
This is the intro to my latest article for the OLL Reading Room. I discuss the American work ethic and Chesterton’s prescient insight into American economic dynamism compared to Britain. (Relatedly, Alex on British stagnation this week.)
Here’s a fun bit of the book that I didn’t include in the OLL article. Chesterton wrote this about seeing New York City for the first time:
But there is a sense in which New York is always new; in the sense that it is always being renewed. A stranger might well say that the chief industry of the citizens consists of destroying their city; but he soon realises that they always start it all over again with undiminished energy and hope. At first I had a fancy that they never quite finished putting up a big building without feeling that it was time to pull it down again; and that somebody began to dig up the first foundations while somebody else was putting on the last tiles. This fills the whole of this brilliant and bewildering place with a quite unique and unparalleled air of rapid ruin.
Interested New Yorkers can find the rest online at Project Gutenberg. Delightful throughout if you like history. Amazon link to the book here.

