In the past year, one cryptocurrency firm after another has gone bust, culminating in the grand implosion of the FTX exchange. The crypto vortex also contributed to some of the recent banking failures.
The prices of cryptocurrencies shot up in 2021, probably fueled by pandemic stimulus money sloshing around in the bank accounts of restless 20- and 30-somethings. All this came crashing back to earth in 2022, giving ample scope for skeptics to say, “I told you this was all foolishness.” Last rites were said, and crypto was left for dead.
But wait… in 2023, when no one was looking, the lid of the crypto coffin started to rattle, a bony hand reached out, and…crypto is back!!
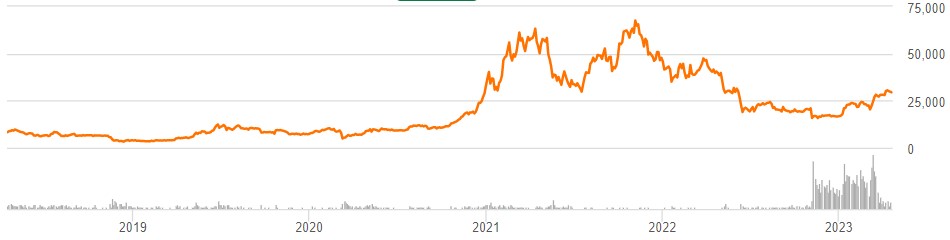
Well, sort of. Here is a five-year chart of Bitcoin from Seeking Alpha, in U.S. dollars:
And here is the past six months:
We can see that Bitcoin took its final big leg down in November, 2022, with the FTX collapse. Its price stayed fairly plateaued down there (with heavy trading volume) until January. Since then, it has nearly doubled.
What has triggered this rise in 2023? Observers such as Michael Grothaus at Fast Company suggests some four factors:
( a ) A shift to “risk-on” with the prospect of the Fed easing off with interest rate hikes this year.
( b ) A flight to alternative assets in the wake of the turbulence in the banking sector. Also, since the total amount of bitcoin is programmed to never increase over a certain number, Bitcoin should be a hedge against inflation. (Many observers believe that the Fed will live with 3-4 % inflation indefinitely, to help inflate away the gigantic debt that the federal government incurred with pandemic relief).
( c ) Buying of Bitcoin by traders who were short, and now need to cover their positions.
( d ) The usual rise in Bitcoin values as a bitcoin “halving” event is on the horizon. (About every four years, with the next time scheduled for May 2024, the rewards for mining new bitcoins drops by 50%).
Will the rise in Bitcoin prices continue? Is this truly a resurrection from the dead, or just a “dead cat bounce”? [1] Nobody knows. But this latest, sustained rally seems to have helped it recover some luster of legitimacy as an asset class. Here is a list of some popular crypto exchanges that are still in operation.
My personal take: I hold a sliver of the Bitcoin fund GBTC, just to have some skin in the game. I have been too lazy to learn about and activate an actual crypto wallet. I think Bitcoin in particular is an intriguing entity. Many other cryptos at some level depend on some centralized administration, but Bitcoin embodies the ideal of a decentralized, power-to-the-people form of something like money.
[1] From Wikipedia: In finance, a dead cat bounce is a small, brief recovery in the price of a declining stock. Derived from the idea that “even a dead cat will bounce if it falls from a great height”, the phrase is also popularly applied to any case where a subject experiences a brief resurgence during or following a severe decline. This may also be known as a “sucker rally”.
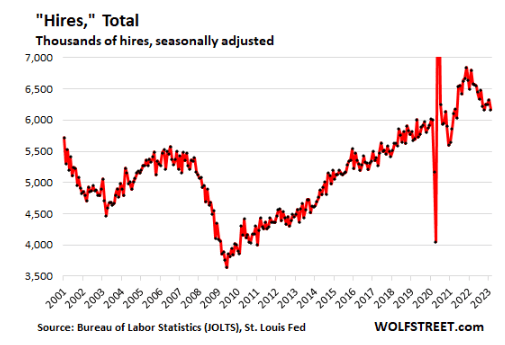
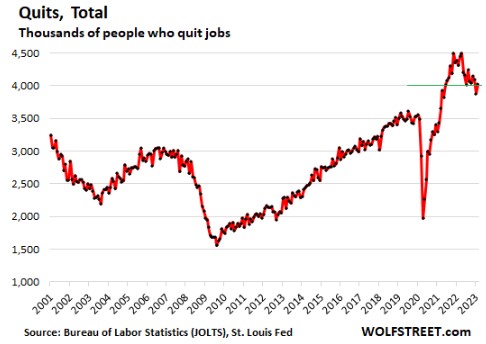
As noted earlier, the main driver in inflation since 2021 has not been supply chain issues, but ongoing wage increases in (mainly) the service industry, fueled by a tight labor market. Some headlines note recent decreases in job openings, etc., suggesting that the end of inflation is near. The point of this post is that measures of labor market tightness remain at very high levels, and so it will be a while yet before the Fed can claim victory over inflation and start meaningfully reducing interest rates.
Below I will post a set of charts (courtesy of Seeking Alpha article by Wolf Richter) which make the following point: most measure of labor tightness remain at least as high as they were in late 2019, just before the pandemic hit. It is true that things have loosened up in the past few months, but that just means the labor market has gone from white-hot to merely red-hot. Let the data speak:
We hold that the current tightness of the labor market is largely a result of pandemic policies which incentivized a whole tranche of experienced workers to take early retirement and also put lots of cash in our pockets which we are spending generously on services . Those workers are not coming back, but at some point in the next 1-2 years the excess Covid cash will run out and we may finally get the long-expected recession. But if the government rushes in with enhanced unemployment benefits to ease the recession pain, we would expect inflation to remain well above the nominal 2% target
As you drive through cities and many suburbs near cities, you see lot and lots and lots of office buildings. Employees by the tens of millions used to get dressed and fight their way through traffic to get to these building every weekday, park, and go up to their desks to do their white-collar jobs.
The demand for new office space seemed endless, and so developers borrowed money to build more office buildings, and firms like real estate investment trusts (REITs) also borrowed money to buy such buildings in order to rent them out.
Covid changed all that. Suddenly, in early/mid 2020, nearly all office buildings went dark, and people started working from home. With affordable computers and internet access, and with Zoom and other conferencing tools, it was found that workers could get their jobs done remotely. Even after vaccines rolled out in early/mid 2021, concerns over contagious Covid variants kept offices closed. 2022 was when things started opening up again big time, and by end 2022/early 2023 there were stories in the news about companies ordering employees back to their desks.
By January, 2023 Bloomberg could report “More than half of workers in major US cities went to the office last week, the first time that return-to-office rates crossed 50% of their pre-pandemic levels.” However, that movement seems to have stalled, and has even reversed in some cases, as workers have pushed back strongly against being forced back to the cubes. Notably, Elon Musk initially banned remote work at Twitter after taking it over in November, but after rethinking the costs of maintaining offices, has shut down Twitter’s offices in Seattle and Singapore, telling employees to work from home
Per the Morning Consult, “The pandemic lockdown triggered one of the swiftest, most significant behavior changes in human history. People’s habits changed overnight, and through the successive lockdowns, shutdowns and new standards, these new habits became ingrained. The experience triggered new, positive associations with working from home, working out with virtual trainers, cooking, gardening and more. A vast web of neural pathways formed to hold these new associations – and that web runs deep.”
And thus, many office buildings remain largely empty, which in turn is resulting in rising defaults on the loans for these buildings. A number of high profile corporate owners in recent months have deliberately (in their own pecuniary interest) defaulted on their loans, forfeited their equity interest in a building , and handed the keys back to the mortgage lenders, who are now stuck with big losses on their loans and with holding a building that nobody much wants.
There are many ramifications of these trends. The one I will focus on is how this extended underutilization of offices affects the parties that lent money to build or buy these buildings. In many cases, those lenders were smaller (regional) banks. They have much greater exposure to commercial real estate loans than the larger banks, which may cause serious problems in the coming months.
Eric Basmajian calls out some key differences between large and small banks in the U.S.:
At large US banks, loans make up 51% of total assets. Small banks have 65% loans as a percentage of total assets. So small banks have a lot of loans, and large banks have a lot of cash, Treasury bonds, and MBS.
…At small US banks, loans make up 65% of assets. Of that loan portfolio, real estate is 65%, meaning a lot of real estate exposure….Within that real estate loan portfolio, almost 70% was commercial real estate lending. So small banks have a high concentration of commercial real estate loans…. Within the commercial real estate category, the highest concentration is “non-residential property,” which can include office buildings, retail stores, and data centers.
….So small banks have a potentially large problem. Deposits are starting to leave after the SVB crisis in search of more safety, but also in search of higher yields on safe assets like Treasury bills. Deposit outflows will make it hard for small banks to grow lending and may cause a deleveraging. If deposit outflows are severe, deleveraging will cause banks to sell securities or loans.
Securities can be pledged at the Fed for a relatively high-interest rate. This keeps a bank solvent but at a material hit to earnings. The loan portfolio is a much bigger problem because the value of these potentially permanently impaired assets will be called into question.
Basmajian summarizes:
There are major differences between large and small US banks.
Large banks hold a lot of reserves, Treasuries, MBS, and residential real estate loans. The asset mix at large banks is very conservative.
Small banks have most of their assets in loans, with commercial real estate holding the highest weight. Small banks appear to have outsized exposure to highly impaired office buildings which could generate significant losses.
It will be critical to monitor lending standards and availability at small banks because, in the post-2008 cycle, small banks are the lifeblood of credit to the private economy.
It has been a tumultuous several weeks in the world of finance. Just when “soft landing” (i.e., the notion that Fed rate hikes would tame inflation without causing a nasty recession) was the meme, a string of banks went belly-up. We summarized the history and status of this dismal parade of corpses a week ago.
On Friday, Germany’s Deutsche Bank (DB) was added to the list of endangered financial species. Its share price plunged as the cost of insuring its credit swaps soared, a sign of lack of confidence in DB among other financial parties. As best I can discern, however, DB is a relatively poorly-managed bank, but not one teetering on insolvency like Credit Suisse or the smaller American banks that have collapsed.
Silicon Valley Bank Getting Sold Off, Finally
On this side of the pond, the big news is that Silicon Valley Bank (SVB), whose spectacular implosion was really what brought “crisis” to banking, will be taken over by another regional bank, First Citizens Bank of North Carolina. The first attempt to auction off SVB was a fizzle, so the feds tried again. They really, really wanted to get this kind of full takeover deal done (rather than breaking up SVB and selling off bits piecemeal), so First Citizens was able to drive a juicy bargain. First Citizens was a fairly modest-sized bank, about half the size of SVB at the end of last year. First Citizens will get SVB assets of $110 billion, deposits of $56 billion and loans of $72 billion, and will start operating the SVB branch offices again. They will pay only $55 billion for the nominal $72 billion in loans that SVB had made, a 29% mark-down. The cost to the FDIC for this deal is about $20 billion. (I don’t know how First Citizens is paying for this acquisition). First Citizens stock skyrocketed on this news, so the market sees this as a sweet deal for First Citizens.
Going forward, the FIDC has pledged to share any losses (or gains) on those loans in the future, which offers further protection to First Citizens. FDIC gets shares of First Citizens valued up to $500 million. First Citizens decided not to take an additional $90 billion in securities that the FDIC will now have to sell on its own. These are likely the long-term bonds which sunk SVB when their value cratered with rising interest rates this past year. I’m not sure how much further losses the FDIC will bear on these bonds.
Anyway, so far, so good, kind of; it is sobering to note that this $20 billion cost to the FDIC just chewed up 1/6 of its total $128 billion kitty for backstopping all qualifying deposits at all banks in America. So we can’t readily afford too many more meltdowns of this magnitude.
Bank Deposits Continue to Flee, But Slower
A worrisome trend in the past month or so has been for depositors to pull their funds from bank checking/savings accounts, and stash their money instead in higher yielding money market funds or CDs or Treasury bills. Banks have borrowed records amounts from the Fed in recent weeks, in order to have lots of cash on hand if they have to pay off departing clients. And within the banking system, about half a trillion dollars has been moved from smaller regional banks to large banks.
I can’t find the reference now, but in the past two days I read an article stating that rate of deposit withdrawals is slowing down, and will likely not of itself destabilize the system. I’m going with that narrative, for now.
An indirect fallout from all this bank turmoil is the reduced inclination of banks to extend loans to businesses. This will make for a slowdown in economic activity, which should cool off inflation – -which is exactly what Jay Powell was hoping would be the outcome of the Fed rate hikes.
So much has been happening in the banking world it is a little hard to keep track of it. See recent articles here by fellow bloggers Mike Makowsky, Jeremy Horpedahl, and Joy Buchanan. Here is a quick guide to all the drama.
Credit Suisse Takeover by UBS
Perhaps the biggest, newest news is a shotgun wedding between the two biggest Swiss banks announced over the weekend. Credit Suisse is a huge, globally significant bank that has suffered from just awful management over the last decade. Its missteps are a tale in itself. Its collapse would be an enormous hit to the Swiss financial mystique, and would tend to destabilize the larger western financial system. So the Swiss government strong-armed a takeover of Credit Suisse by the other Swiss bank behemoth, UBS, in an all-stock transaction. The government is providing some funding, and some guarantees against losses and liability. An unusual aspect of this deal is that Credit Suisse shareholders will get some value for their stock, but a whole class of Credit Suisse bonds Is being written down to zero. Usually bond holders have strong priority over stockholders, so this may make it more difficult for banks to sell unsecured bonds hereafter.
Silicon Valley Bank Collapse: Depositors Protected
The Silicon Valley Bank (SVB) collapse is old news by now. The mismanagement there is another cautionary tale: despite having a flighty tech/venture capital deposit base, management greedily reached for an extra 0.5% or so yield by putting assets into longer-term bonds that were vulnerable to a rise in interest rates instead of into stable short-term securities.
A key step back from the brink here was the feds coming to the rescue of depositors, brushing aside the existing $250,000 limit on FDIC guarantees. That was an important step, otherwise large depositors would stampede out of all the regional banks and take their funds to the few large banks that are in the too-big-to-fail category. It is true that this new level of guarantee encourages more moral hazard, since depositors can now be more careless, but the alternative to guaranteeing these deposits (i.e. the collapse of regional banks) was just too awful. Bank shareholders and most bondholders were wiped out. Presumably that will send a message to the investing community of the importance of risk management at banks.
The actual disposition of the business parts of SVB are still being worked out. The feds originally tapped the big, well capitalized banks to see if one of them would take over SVB as a going concern. That would have been a nice, clean, thorough resolution. But the big banks all declined. I suspect the actual responses in private were unprintable. Here’s why: in the 2008 banking crisis, the Obama-Biden administration went to the big banks and encouraged them to take over failing institutions like Countrywide Mortgage, who among other things had made arguably predatory loans to subprime borrowers who had poor prospects to keep up with the mortgage payments. The Obama administration’s Department of Justice promptly turned around and very aggressively prosecuted these big banks for the sins of the prior institutions. J. P. Morgan ended up paying something like 13 billion and Bank of America paid 17 billion. So when today’s Biden administration reached out to these big banks this month to see about taking over SVB, they got no takers.
Now the assets of SVB (renamed Silicon Valley Bridge Bank) are getting auctioned off, perhaps piecemeal, but how exactly that happens does not seem so critical.
Signature Bank: Shut Down, But Sold Off Intact
Crypto-friendly Signature Bank was shuttered by New York State officials on Sunday, March 12, making this the third largest (SVB was the second largest) bank failure in U.S. history. Forbes gives the whole story. At the end of last year, Signature had over $110 billion in assets and $88 billion in deposits. Spooked by Signature’s similarities to failed banks SVB and Silvergate, customers rushed to withdraw deposits, which the bank could not honor without selling securities at huge losses. As with SVB, the feds had the FDIC insure all deposits of all sizes at Signature.
Unlike SVB, Signature has received a bid for the whole business, from New York Community Bancorp’s subsidiary Flagstar Bank. Flagstar will take over most deposits and loans and other assets, and operate Signature Bank’s 40 branches.
First Republic: Teetering on The Brink, Propped Up by Banking Consortium
First Republic is in a somewhat different class than these other troubled institutions. Its overall practices seem reasonable, in terms of equity and assets. However, it caters to a wealthy clientele in the Bay Area, with a lot of accounts over the $250,000 threshold. In the absence of a rapid and decisive move by Congress to extend FDIC protection to all deposits at all banks, somehow (I haven’t tracked what started the stampede) depositors got to withdrawing huge amounts (like $70 billion) last week. This was a classic “run on the bank.” That would stress any bank, despite decent risk management. Once confidence is lost, it’s game over, since there are always alternative places to park one’s money. Ratings agencies downgraded First Republic to junk status, and the stock has cratered.
It is in the interest of the broader banking industry to forestall yet another collapse. If folks start to generally mistrust banks and withdraw deposits en masse, our whole financial system will be in deep trouble. In the case of First Republic, the private sector is trying to prop up it up, without a government takeover. So far this has mainly taken the form of depositing some $30 billion into First Republic, as deposits (not loans or equity), by a consortium of eleven large U.S. banks led by J. P. Morgan. This is was a quick and fairly unheroic intervention, since in the event of liquidation, depositors (including this consortium) have the highest claim on assets. This intervention will probably prove insufficient. Two potential outcomes would be a big issuance of stock to raise capital (which would dilute existing shareholders), or some large bank buying First Republic. The stock rose today on reports that Morgan’s Jamie Dimon was talking with other big banks about taking an equity stake in First Republic, possibly by converting some of the $30 billion deposit into equity.
Old News: Silvergate Bank Liquidation
Overshadowed by recent, bigger collapses, the orderly shutdown of the crypto-focused Silvergate Bank is old news. It was two weeks ago (March 8) that Silvergate announced it would shut down and self-liquidate. The meltdown of the crypto financing world led to excessive loss of deposits at Silvergate. Unlike SVB and Signature, it held a lot of its assets in more liquid, short-term securities, so its losses have not been as devastating – – all depositors will be made whole, though shareholders are toast (stock is down from $150 a year ago to $1.68 at Monday’s close).
Warren Buffett To the Rescue?
Banks generally operate on the model of borrow short/lend long: they “borrow” from depositors and buy longer-term securities. Normally, short-term rates are lower than long-term rates, so banks can pay out much lower interest on their deposits than they receive on their bond/loan investments. With the Fed’s rapid increases in short-term rates this past year, however, the rate curve is heavily inverted, which is disastrous for borrow short/lend long. Fortunately for banks, many depositors are too lazy to do what I have done, which is to move most of my immediate-need money out of bank accounts (paying maybe 1%) and into T-bills and money market funds paying 4-5%.
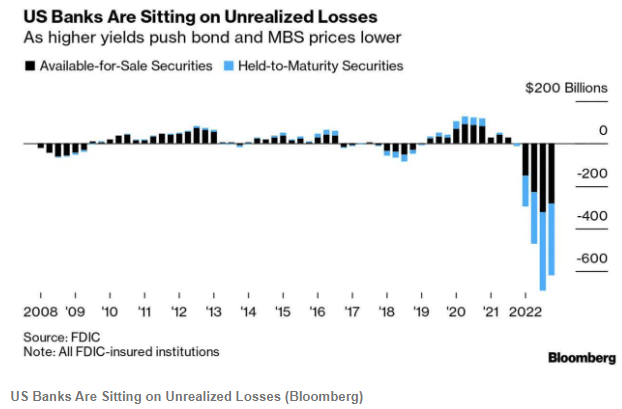
All this churn goes to highlight an inherent fragility of banks: there is typically a maturity mismatch between a bank’s deposits/liabilities (which are short-term and can be withdrawn at any time) and its assets (longer-term bonds it purchases, and loans that it makes which can be difficult to quickly liquidate). Runs on banks, where if you were late to panic you lost all your deposited money, used to be a real feature of life, as dramatized in classic films Mary Poppins and It’s a Wonderful Life. Eliminating this danger was a key reason for setting up the Federal Reserve system, and in general that has worked pretty well in the past hundred years. Banks in general (see chart above) are now carrying enormous amounts of unrealized losses on their portfolios of bonds and mortgage-backed securities (MBS) due to the increase in market rates. In addition to the existing “discount window” at which banks can borrow, the Fed has set up a new lending facility to help tide banks over if they (as in the case of SVB and Signature) get stressed by having to sell marked-down securities to cover withdrawal of deposits. Also, new measures reminiscent of 2008 were announced to extend dollar liquidity to central banks of other nations.
But when Gotham really has a problem, the Commissioner calls in the Caped Crusader. Warren Buffett has been in touch with administration officials about the banking situation. We wrote two weeks ago about Warren Buffett’s gigantic cash hoard from the float of his Berkshire Hathaway insurance businesses which allows him to quickly make deals that most other institutions cannot. Buffett rode to the rescue of large banks like Bank of America and Goldman Sachs in the 2008-2009 financial crisis. A lot of corporate jets have been noted flying into Omaha from airports near the headquarters of various regional banks. Buffett’s typical playbook in these cases is to have the troubled institution issue a special class of high yielding (with today’s regional banks, think: 9%) preferred stock that he buys, perhaps with privileges to convert into the common stock. That stock would count as much needed equity in the banks’ books.
On the Positivity Blog are no less than “67 Don’t Look Back Quotes to Help You Move on and Live Your Best Life”. Some of these sayings from notable folks include:
“Never look back unless you are planning to go that way.” – Henry David Thoreau
“If you want to live your life in a creative way, as an artist, you have to not look back too much. You have to be willing to take whatever you’ve done and whoever you were and throw them away.” – Steve Jobs
“There are far, far better things ahead than any we leave behind.” – C.S. Lewis
“Don’t cry because it’s over, smile because it happened”
– attributed to Dr. Seuss, though that attribution is heavily disputed
The Random Vibez offers another “60 Don’t Look Back Quotes To Inspire You To Move Forward”’ including “Don’t look back. You’ll miss what’s in front of you” and “I tend not to look back. It’s confusing”. The Bible would add sayings such as, “Let your eyes look straight ahead; fix your gaze directly before you” (Proverbs 4:25); Paul wrote to the Philippians, “One thing I do: Forgetting what is behind and straining toward what is ahead, I press on toward the goal to win the prize for which God has called me”.
The Landy-Bannister Statue
What put me in mind of this whole theme of not looking back was seeing a bronze statue involving Roger Bannister. Sports buffs, and most educated people who are over 60, will know that he was the first man to break the four-minute mile. During many previous decades of trying, no human had been able to run that fast that long: that is a velocity of 15 miles per hour, sustained for a full four minutes. That is like a full sprint for most people, or a moderate bicycling speed.
Bannister found that he was naturally a fast runner, and he employed scientific principles in his training. (He was a medical student at the time, and went on to become a noted research neurologist). On May 6, 1954 Bannister finally cracked the four-minute mile, with a 3:59.4 time. As may be imagined, the crowd went wild.
Records, however, are made to be broken, and just 46 days later a rival runner, John Landy, ran the mile in just 3:57.9 to become the world’s fastest man. A few months after that Bannister and Landy ran head-to-head in the August, 1954 Commonwealth games in Vancouver. Landy was in the lead nearly the whole way, with a ten-yard lead by the end of the third lap. Bannister then started his signature kick and managed to catch up with Landy on the final bend. Landy must have heard footsteps, and at the end of the race glanced over his left shoulder to gauge Bannister’s position. That distraction slowed him just enough to allow Bannister to power past him on his right side. Landy’s time was still a respectable 3:59.6, but Bannister won with 3:58.8. Both runners later agreed that Landy would have won if he had not looked back. More on that race, including link to video of it, here.
This finish of this “Miracle Mile” race was immortalized by a larger-than-life bronze statue by Vancouver sculptor Jack Harman. Landy later quipped, “”While Lot’s wife was turned into a pillar of salt for looking back, I am probably the only one ever turned into bronze for looking back.”
Warren Buffett is referred to as “the legendary investor Warren Buffett” or “the sage of Omaha”. The success of his Berkshire Hathaway fund is remarkable. He is also a pretty nice guy, and every year writes (with help, I’m sure) a letter describing the activities of his fund, along with general observations on investing and the economy. His letter covering 2022 was published two weeks ago.
Buffett noted that he and his team invest in companies in two ways: by buying shares to become a partial “owner” along with thousands of other shareholders, and also by buying ownership of the whole company. They aim to hold American companies that have a good business model, and will keep growing profits for years or decades. They look for great businesses at great prices, but they would rather buy a great business at a good price, than to buy a (merely) good business at a great price.
He was refreshingly honest about his overall stock picking record:
In 58 years of Berkshire management, most of my capital-allocation decisions have been no better than so-so. In some cases, also, bad moves by me have been rescued by very large doses of luck. (Remember our escapes from near-disasters at USAir and Salomon? I certainly do.) Our satisfactory results have been the product of about a dozen truly good decisions – that would be about one every five years – and a sometimes-forgotten advantage that favors long-term investors such as Berkshire.
In 1994 they bought a then-huge stake ($ 1.3 billion) in Coca-Cola, and another $1.3 billion stake in American Express. As it turned out, these two companies had the staying power that Buffet had anticipated, and have grown enormously in value over the past three decades.
In addition to their wholesome stock-picking philosophy, the “secret sauce” of Berkshire Hathaway is having the available funds to make those great investments in those great companies. These funds came large from the “float” from their insurance businesses. In Buffett’s words:
In 1965, Berkshire was a one-trick pony, the owner of a venerable – but doomed – New England textile operation. With that business on a death march, Berkshire needed an immediate fresh start. Looking back, I was slow to recognize the severity of its problems. And then came a stroke of good luck: National Indemnity became available in 1967, and we shifted our resources toward insurance and other non-textile operations.
The insurance business is interesting, in that clients pay in money “now”, but it does not get paid out until “later”. The insurance company has the money to own and manage until there is some claim event (e.g., someone dies or gets their home flooded) perhaps many years later. The traditional, conservative way for insurance companies to manage this float money was to invest it in low-paying but ultra-safe investment grade bonds.
Buffett’s key secret to success was to realize that he could invest at least part of these float funds in stocks, which would (hopefully!) over time make much more money than bonds. That gave him the cash to make those great investments in Coke and Amex. And his fund continues to have billions in hand to make strategic investments. He has made a bundle bailing out good companies that fell into short term difficulties. In his words:
Berkshire’s unmatched financial strength allows its insurance subsidiaries to follow valuable and enduring investment strategies unavailable to virtually all competitors. Aided by Alleghany, our insurance float increased during 2022 from $147 billion to $164 billion. With disciplined underwriting, these funds have a decent chance of being cost-free over time. Since purchasing our first property-casualty insurer in 1967, Berkshire’s float has increased 8,000-fold through acquisitions, operations and innovations. Though not recognized in our financial statements, this float has been an extraordinary asset for Berkshire.
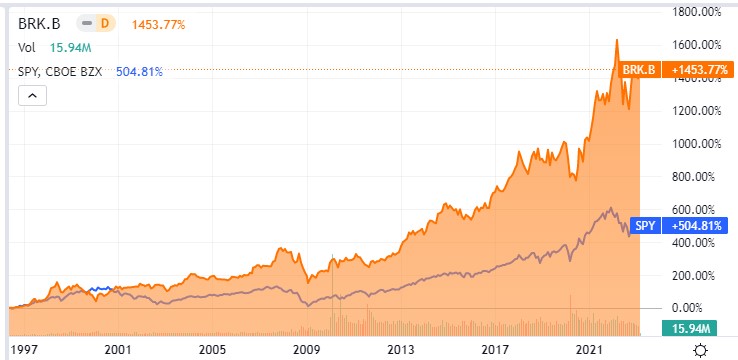
You, too, can participate in Buffett’s investing magic, by buying shares in Berkshire Hathaway. The stock symbol is BRK.B. (Disclosure: I own a few shares). Buffett has been skeptical of flashy tech stocks, and so BRK.B’s performance lagged the S&P 500 fund SPY in 2020-2021, but over the long term Berkshire (orange line in chart below) has crushed the S&P:
I keep reading about how inflation has peaked (even peaked many months ago) and so any minute now the Fed will relent on raising interest rates, and will in fact start reducing them. Every data point that seems to support an early Fed pivot and a gentle “soft landing” for the economy is greeted with optimistic verbiage and a rip higher in stocks.
Except – – other meaningful data points regularly appear which show that inflation (especially core inflation) is remaining stubbornly high. The Personal Consumption Expenditures (PCE) Index is the Fed’s preferred way to track core inflation. It did peak in early 2022, and is falling, but very slowly and fitfully. Just when it seems like it is about to cascade downward, along comes another uptick. The latest report for 02/24/23 showed the PCE index (excluding the volatile categories of food and energy) increasing 0.6 percent during the month of January, which translated to a 4.7 percent year-on-year gain. That was considerably higher than the 0.4 percent monthly gain (4.3 percent year-on-year) that economists expected.
The chart below illustrates the chronic tendency of the economists at the Fed to lowball the estimates of future inflation. Each of the ten bars depicts quarterly projections of what inflation would be for 2023, starting back in September 2020 (first, green bar). No one in the craziness of 2020 could be held particularly responsible back then for accurately projecting 2023 conditions. But the Fed embarrassed themselves badly into late 2021 by airily dismissing inflation as “transitory”, due mainly to supply chain constraints that would quickly pass. (See towards the middle of the chart, yellow Sept 2021 and blue Dec 2021 bars projecting a mere 2.2% inflation for 2023.)
Only as of December 2022 did estimates of inflation jump up to 3.1% for 2023, and that estimate will surely get revised upward even further.
Many factors probably went into this systematic failure on the part of the Fed economists. There are probably political reasons for erring on the rosy optimistic side, which I will not speculate on here.
One factor in particular was mentioned in the Minutes of the Jan 31/Feb 1 Fed meeting that I thought was significant:
A few participants remarked that some business contacts appeared keen to retain workers even in the face of slowing demand for output because of their recent experiences of labor shortages and hiring challenges.
Jeremy LaKosh notes regarding this feature, “If true across the economy, the idea of keeping employees for fear of facing the labor force shortage would represent a fundamental shift in the employment market. This shift would make it harder for wage increases to mitigate towards historical norms and keep upward pressure on prices.”
This all rings true to my anecdotal observations. In bygone days, when business slowed down, factories would lay off or furlough workers, with the expectation on all sides that they would call the workers back (and the workers would come back) when conditions improved. However, employers have had to struggle so hard this past year to find willing/able workers, that employers are loath to let them go, lest they never get them back. I have read that even though homebuilders are not sure they can sell the houses they are building, they are so worried about losing workers that they are keeping them on the payroll, building away.
Other inflation data points show big decreases in prices for goods (and energy), but not for services. Wages, of course, are the big driver for service costs.
So the inflation story in 2023 seems to come down largely to a labor shortage. This is a large topic cannot be fully addressed here. I will mention one factor for which I have anecdotal support, that the enormous benefits (stimulus money plus enhanced unemployment) paid out during 2020-2021 set up a large number of baby boomers to leave the workforce early and permanently. Studies show that this is a major factor in the drop in workforce participation rate post-Covid. Maybe some of those folks had not planned ahead of time for such early retirement, but they got a taste of the good life (NOT getting up and going to work every day) in 2020-2021 along with the extra cash to pad their savings, and so they decided to just not return to work. That exodus of trained and presumably productive workers has left a hole in the labor force which now manifests as a labor shortage, which drives up wages and therefore inflation and therefore interest rates, which will eventually crater the economy enough that struggling firms will finally lay off enough workers to mitigate wage gains.
I wonder if this unhappy scenario could be staved off with increased legal migration of targeted skilled workers from other countries to alleviate the labor shortage. Dunno, just a thought.
This post is to share some observations that may be helpful to readers who, like me, were rudely surprised by the simultaneous steep decline in both bonds and stocks in the past year.
Bonds and Stocks Are No Longer Inversely Correlated
Back in the day before routine, massive Federal Reserve interventions, say before the 2008 Great Recession, there was a more or less routine business cycle. In an expansionary phase, GDP would increase, there was greater demand for loans, company profits would rise and so would stock prices and interest rates. When interest rates go up, bond prices go down. When the cycle rotated to the recessionary downside, all this would reverse. Stocks would go down, interest rates would decline and investors would flee to bonds, raising their prices.
Thus, bonds served as a good portfolio diversifier, since their prices tended to move inversely to stocks. Hence, the traditional 60/40 portfolio: 60% stocks, 40% bonds, with periodic rebalancing between the two classes.
This approach still worked sort of OK from 2008-2021 or so. The Fed kept beating interest rates lower and lower, and so bond prices kept (fitfully) rising. But at last we hit the “zero bound”. Short- and long-term interest rates went to essentially zero in the U.S. (and actually slightly negative in some other developed countries). Rates had nowhere to go but up, and so bond prices had no place go but down, no matter how stocks performed.
Trillions of dollars of federal deficit spending to pay out various COVID-related benefits in 2020-2021, along with supply chain interruptions, ignited raging inflation in 2022, which the Fed belated addressed with a series of rapid rate hikes and reductions in its bond holdings. The end of easy (nearly no-interest) money and the prospect of a recession knocked stock prices down severely in 2022. However, the rise in both short term and long term interest rates also cratered bond prices. The traditional 60/40 portfolio was decimated. Thus, in an inflationary environment with active Fed intervention, bonds are much less useful as a portfolio diversifier.
Both the stock and bond markets seem to be now driven less by real-world considerations and more by expectations of Fed (and federal government) reactions to real-world occurrences. Pundits have noted the “bad news is good news” effect on stock prices: if GDP dips or unemployment rises (which used to be considered recessionary bad news), the markets cheer, assuming that if any real economic pain occurs, the federal government will flood us with benefits and the Fed will lower rates and buy bonds and otherwise facilitate the renewed deficit spending. (See The Kalecki Profit Equation: Why Government Deficit Spending (Typically) MUST Boost Corporate Earnings for an explanation of why deficit spending normally causes a rise in corporate profits, and hence in stock prices.)
In 2022, there was practically no place to hide from investment losses. Petroleum-related stocks furnished one of the few bright spots, but that was partly a function of economies recovering that year from COVID lockdowns. There is no particular reason to believe that petroleum stocks will rise in the next market downturn. Oil and gas stocks, along with gold and other commodities, might offer a certain degree of diversification, but none of these can be assumed to normally rise (or even stay steady) when the general stock market falls.
Managed Futures Funds as Portfolio Diversifiers
It turns out that there is one class of investable assets that does tend to rise during an extended market downturn, while typically rising slowly or at least staying level during stock bull markets. That is managed futures funds. These funds observe pricing trends across a wide range of commodities and currencies and bond markets, and buy or sell futures to try to profit. If they (or their algorithms) guess right, they make steady, small gains. If there is a new, strong trend that they can buy into, they can make a lot of money quickly. Such was the case for most of 2022. It was obvious that the Fed was going to raise rates heavily that year, which would drive up interest rates and the value of the dollar versus other currencies, and would crush bond prices. The managed futures funds shorted the Euro and bonds, and made a ton of money January-November last year. Investors who held these funds were glad they did. Charts to follow.
The first chart here shows the total returns for the S&P 500 stock index (blue) and a general bond fund, BND (purple), for the past three years, ending Feb 13, 2023. (Ignore the orange curve for the moment). This chart captures the short but very sharp drop in stock prices in early 2020, as COVID lockdowns hit, but government aid was promised. Bonds did not greatly rise as stocks fell then, although after a bit of wobble they stayed fairly steady in early 2020. However, when stocks slid down and down during most of 2022, bonds went right down with them (purple drawn-in arrow), giving no effective diversification. Both stocks and bonds rose in early 2023, showing what is now a positive correlation between these two asset classes.
The next chart (below) omits the bonds line, showing just the blue stocks curve and the orange curve, which is for a managed futures fund, DBMF. The drawn-in red arrows show how DBMF only dipped a little during the COVID crash in early 2020, and it rose greatly in 2022, as stocks (blue arrow) collapsed. This shows the power of managed futures for portfolio diversification.
There was a surprising break in futures trends in November, 2022, as markets suddenly started pricing in an early Fed pivot towards easing in 2023, and so interest rates rose, and bonds and the U.S. dollar tumbled. All the managed futures funds took a sharp hit Nov-Dec 2022; some of them recovered better than DBMF, which kept drifting down for the next few months. Without getting too deep in the weeds, DBMF is an exchange-traded fund (ETF) with favorable fees and taxation aspects for the average investor. However, its holdings are chosen by observing the recent (past few weeks) behavior of other, primary managed futures funds, and trying to match the average performance of these funds. Some of these other, similar funds are EBSIX, PQTNX, GIFMX and AMFNX. These are mutual funds, rather than ETFs, with somewhat higher fees and higher minimum purchases, depending on which “class” of these funds you go with (A, C, or I).
This average matching technique is good, because the performance of any single one of the major managed futures funds can be really good or really any particular year. Some of these individual funds have done consistently horribly, so you’d be in bad shape if you happened to pick one of those. But the average of all those funds, as quantified by a relevant index, does OK and so does DBMF. However, as observed by Seeking Alpha author Macrotips Trading, because of its backwards-looking matching methodology, DBMF can be appreciably slower than other funds to adjust its positions when trends change. KMLM is another managed futures ETF, which tends to be more volatile than DBMF; higher volatility may be desirable for this asset class.
One Fund to Rule Them All
A recommended application of these managed futures funds is to replace maybe a third of your 40% bond holdings with them. Back testing shows good results for say a 15 managed futures/25 bonds/ 60 stocks portfolio, which is periodically rebalanced.
What if there was a fund which combined stocks and managed futures under one wrapper? There is one I have found, called REMIX. It has an “institutional” class, BLNDX, with higher minimum purchase and slightly lower fees, which I have bought into. The chart below shows the past three years of performance for the hybrid REMIX (orange) compared to stocks (blue) and the managed futures-only fund DBMF. We can see that REMIX stayed fairly flat during the COVID blowout in 2020, and it rose along with stocks in 2021, and went roughly flat in 2022 instead of dropping with stocks (see thick drawn-in yellow arrows). The performance of REMIX is actually better than a plain average of stocks (blue curve) and DBMF (purple), so this is an attractive “all-weather” fund. A similar hybrid (multi-asset) fund is MAFCX, which has higher fees but perhaps slightly higher returns to date. MAFCX buys stock (S&P500) futures rather than the stocks themselves, which is a leveraged play – – so for $100 investment in MAFCX you get effectively $100 worth of managed futures plus $50 worth of stock investment.
Managed futures put in an outstanding performance in 2022 because there was a well-telegraphed trend (Fed raising interest rates) in place for many months, which allowed them to make easy profits at the same time that stocks were crashing. But we cannot assume that managed futures will always go up when stocks go down. That said, managed futures will likely be reasonable diversifiers, since they should at least stay roughly level when stocks go down. The trick is to not grow impatient and dump them if their prices stagnate during a long bull stock market phase. Holding them in the form of a multi-asset fund like REMIX may help investors hang in there, since it should go up in a bull market (due to its stock component), while offering protection in a bear.
For instance, below is a five-year chart of a managed futures fund ( EBSIX, purple line ), the S&P 500 stock index (blue line), and a multi-asset fund that combines stocks and managed futures ( MAFIX, orange line. This is the institutional version of MAFCX). The charting program did not account properly for the Dec 2022 dividend of MAFIX, so I extended its curve with a short red line at the right-hand side to show what it should look like if plotted on a consistent total return basis.
With perfect hindsight, I chose a managed futures fund (EBSIX) which has performed among the best over the years; many other such funds would have looked far worse. There was a period of nearly two years (mid-2020 -early 2022) when this fund lagged far behind stocks. It was only when the 2022 catastrophe arrived that the managed future fund EBSIX proved its worth and shot up. The multi-asset fund MAFIX, which is similar to REMIX but with higher fees, basically kept up with stocks in their bull phase, then held more or less steady for 2022, and ended much higher over five years than either SP500 or the plain EBSIX.
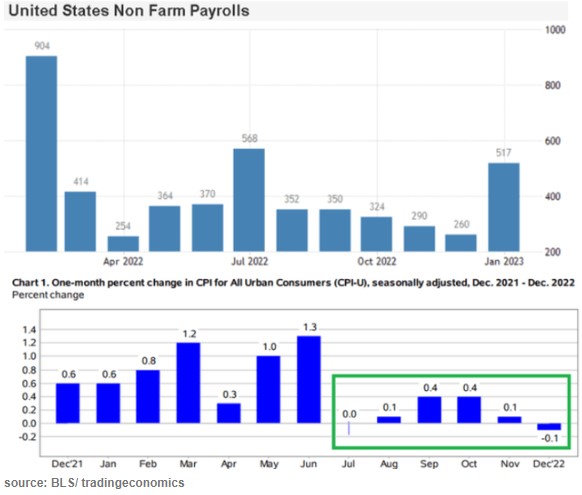
The stock market drools and rips higher at the slightest sign that inflation is abating, since that portends rate cuts instead of rate hikes by the Fed, and a return to the golden days of easy money. But what do the latest data show? Here I’ll show several charts to show what we know so far.
The last couple months’ data points in the lower chart show that inflation (as estimated by CPI) has essentially leveled out and may be starting to decline a little. That is fine but it still leaves inflation far above the Fed’s 2% target. Victor defines a Fed “pivot” not as actually cutting rates, but simply a halt to raising them. By that somewhat anemic definition, sure, a Fed pivot could well come in the next few months. But that leaves rates still very high by recent standards. The real question is when will inflation come down low enough to justify significant rate cuts. The Fed screwed up so abysmally last year with its ridiculous “this inflation is only transitory supply chain issues” that they really cannot afford to relent too soon, and let inflationary psychology take hold.
Side comment: the big “blowout” jobs number for January (last bar on the right, on the top chart above) caused a huge buzz. But there are strong reasons to discount it as an artifact of “ revisions, adjustments, control factors, and recoding “, per Jeffrey Snider.
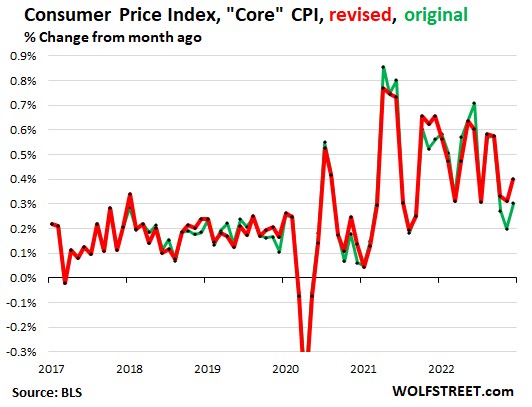
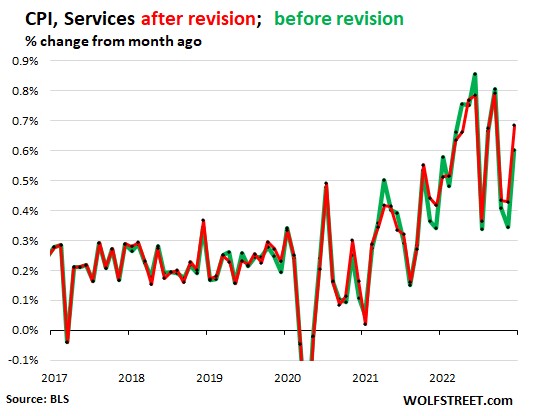
On the other side of the bull/bear divide, Wolf Richter published a glass-half-empty article noting how the Bureau of Labor Statistics recently revised its CPI numbers, and the changes shifted the numbers so as to undermine the argument that inflation has started to drop rapidly:
The chart above with revisions (red line) shows core CPI barely declining over the past 9 months or so, and no trend for an acceleration in that decline. The chart below shows CPI for Services (where we consumers spend most of our money, and which is closely correlated to wages) is holding nearly steady around a red-hot 0.55%/month or about 6.6% annualized. It could be longer than the market thinks before there are substantial rate cuts.
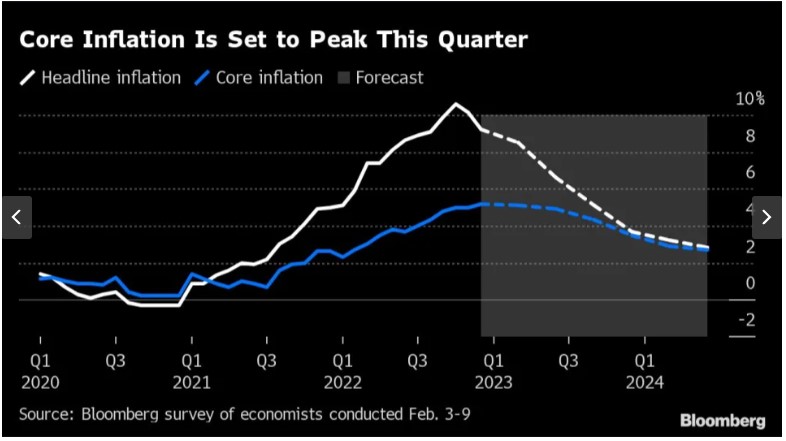
And from the Eurozone, there is this chart, courtesy of Bloomberg via Yahoo, depicting the results of polling economists as to the future course of inflation there:
The consensus view is that inflation in Europe will not approach the 2% target until well into 2024. The European Central Bank is expected to hike by 0.5% in March, followed by another 0.25% to reach 3.25%. (This is much lower than the Fed’s interest rates, but that is probably because the U.S. is still working off the orgy of COVID-related payments that dumped trillions in peoples’ pockets here in 2020-2021). Cuts by the ECB are not expected until the second quarter of 2024.
THIS JUST IN: The January CPI data just came out today (2/14), and pretty much matches up with the picture presented above. Inflation is falling, but ever so slowly, and so it becomes more likely that the Fed will keep its rates higher for longer:
“The Consumer Price Index (CPI) for January showed a 0.5% increase in prices over the past month, an acceleration from the prior reading, government data showed Tuesday. On an annual basis, CPI rose 6.4%, continuing a steady march down from a 9.1% peak last June. Economists had expected prices to climb 6.2% over the year and jump 0.5% month-over-month, per consensus estimates from Bloomberg. …
Core CPI, which strips out the volatile food and energy components of the report, climbed 5.6% year-over-year, more than expected, and 0.4% over the prior month. Forecasts called for a 5.5% annual increase and 0.4% monthly rise in the core CPI reading.”
(For another recent take on the inflation picture, see James Bailey’s The Murky Macro Picture, on this blog).