The Price of Food: Farm to the Table

If you’re like me, then you are very fond of food. What determines the price of food? Supply and demand of course!

We can consider food as a commodity because just about anyone can buy and sell it. Almost all foods have partial substitutes. Therefore, the long-run price in the competitive market for food is largely dictated by the marginal cost. Demand has an impact on the price only in the short run.

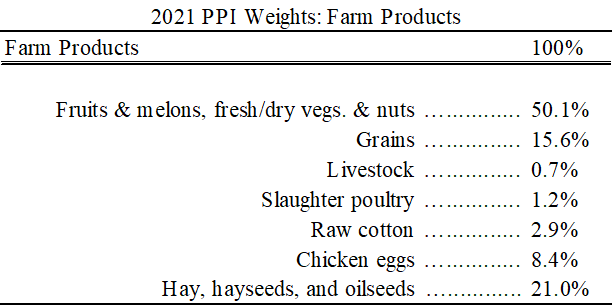
A long-run driver of food prices are the costs that food producers face. The US Bureau of Labor Statistics divides the Producer Price Index into multiple categories that are relevant for a variety of sectors and points within the production process. Below is a table of the most fundamental, relatively unprocessed farm products and their weight among all farm products in December 2021. Cotton is a relatively large component for farm products even though it’s not a food and I include it for completeness. Fruits, veggies, and nuts makeup the overwhelming proportion of the cost of farm products. I was at first surprised that grains composed such a small proportion. But, being dirt cheap, it makes sense.

We all know that inflation has been in the news. It’s been elevated since the second quarter of 2021. Consumer prices tend to lag producer prices. One indicator of where food prices will be in the near future is where the producer prices are now. Below is a graph that displays the above seasonally adjusted farm product prices since the start of 2021*.

Continue reading →

Two Types of News: Elections vs Crashes

Some events are like elections: it was obvious that some big political news would break on Election Day, we just had to wait to find out what exactly would happen. Others are like market crashes: you might know in principle they’re a thing that can happen, but you don’t really expect any particular day to be the day one happens, so they seem to come out of the blue. As it turns out, for one of the largest crypto exchanges the day of the crash also happened to be Election Day.

FTX.com is facing a bank run sparked by competitor Binance tanking the price of the token that backed some of their assets. Customers are having issues withdrawing their money, Binance has withdrawn its offer to bail out FTX by taking them over, and bankruptcy seems likely. Supposedly this doesn’t affect Americans using FTX US, but I’d be nervous about any funds I had there, or indeed with funds in any centralized crypto exchange or stablecoin (Tether and even USDC seem to be having issues holding their pegs). All this was especially shocking because many considered FTX founder Sam Bankman-Fried one of the most trustworthy people in the often sketchy world of crypto. He was always meeting with US regulators and lawmakers, and seems not to be motivated by greed; he had already begun to give away his fortune at scale.

After any surprising event like this, some people claim it was actually obvious and they saw it coming (despite usually never having said so beforehand), while others start looking back for warning signs they missed. The most interesting one is something that shocked me when I first heard it March, but I never considered the risk it implied for FTX until the crash:

Going forward, red flags to watch out for seem to be topping a list of youngest billionaires (as Elizabeth Holmes also did) and buying naming rights to a stadium.

In contrast to this crash, the election happened right when we all expected, and at least largely how I expected. Like markets, I underestimated Democrats a bit; polls overall were impressively accurate this year, though they of course missed on some particular races. Votes are still being counted, and as of now we don’t even know for sure which party will control Congress (PredictIt currently gives Democrats a 90% chance in the Senate and a 20% chance in the House). But here are some early attempts to assess forecast accuracy. As I said, some polls were quite good:

Some polls weren’t so good, which means its important to weight better pollsters more heavily when you aggregate them. Some attempts at that were also quite good:

Oddly, some no money (Metaculus) / play money (Manifold Markets) forecasting sites seem to have done better than the real-money prediction sites:

The Sins of TikTok, Part 1: Extreme Privacy Theft by China-Based Company

Social media apps are nosy by nature; it is no secret that their main business model is to snoop out information about you, the user, and package and sell that information to advertisers who can target you. But there is one wildly popular app which goes beyond the norms of intrusiveness and privacy invasion AND is targeted largely at children and adolescents AND is based in China and thus is subject to Big Brother’s request for any and all data. That app is TikTok.

To avoid a bunch of re-wording, I will largely share excerpts from “ The Privacy Risks of TikTok – Why This Invasive App is So Dangerous “ by Priscilla Sherman at VPNOverview. Other articles echo her concerns with TikTok:

TikTok is an extremely popular social media video app owned by the Chinese tech company ByteDance. On TikTok, users can create and share short-form videos using a variety of filters and effects. The platform is full of dancing, comedy, and other entertaining videos….

Several agencies and news outlets are now sounding the alarm and reporting on the many problems that have surfaced. ByteDance claims to want to break away from its Chinese background in order to serve a global audience and says it will never share data with the Chinese government. This claim, however, seems impossible now that new security laws have been introduced in Hong Kong.

TikTok’s user base mostly consists of children and adolescents, which many consider to be vulnerable groups. This is a main reason for different authorities to express their worries. However, it isn’t just the youth that might be in danger from TikTok. From December 2019 onwards, U.S. military personnel were no longer allowed to use TikTok, as the app was considered a ‘cyber threat’…

[Hacker group] Anonymous has published a video listing the many dangers of TikTok. They quote a source that has done extensive research on TikTok: “Calling it an advertising platform is an understatement. TikTok is essentially malware that is targeting children. Don’t use TikTok. Don’t let your friends and family use it. Delete TikTok now […] If you know someone that is using it, explain to them that it is essentially malware operated by the Chinese government running a massive spying operation.”

These claims fit in with the recent developments surrounding TikTok. For example, Apple researchers announced that TikTok deliberately spies on users.

Claims keep piling up, showing that TikTok is a very invasive application that poses a substantial privacy risk. It seems that the data collection at TikTok goes much further than other social platforms such as Facebook or Instagram. This is surprising, since both of these companies have already faced backlash for the way they’ve dealt with user privacy. TikTok seems to collect data on a much larger scale than other social media platforms do. This, combined with TikTok’s origins makes it quite plausible that the Chinese government has insight into all of this collected data…..

Research from a German data protection website has revealed that TikTok installs browser trackers on your device. These track all your activities on the internet. According to ByteDance, these trackers were put in place to recognize and prevent “malicious browser behavior”. However, they also enable TikTok to use fingerprinting techniques, which give users a unique ID. This enables TikTok to link data to user profiles in a very targeted way.

Unfortunately, this happens with a great disregard of privacy – perhaps intentionally so. The German researchers indicate, for example, that IP addresses aren’t anonymized when TikTok uses Google Analytics, meaning your online behavior is directly linked to your IP address. An IP address provides information about your location and, indirectly, about your identity…

A user on Reddit used reverse engineering to figure out more about TikTok. Anonymous quoted the results in the video we mentioned earlier. The Reddit user discovered that TikTok collects all kinds of information:

  • Your smartphone’s hardware (CPU type, hardware IDs, screen size, dpi, memory usage, storage space, etc.);
  • Other apps installed on your device;
  • Network information (IP, local IP, your router’s MAC address, your device’s MAC address, the name of your Wi-Fi network);
  • Whether your device was rooted/jailbroken;
  • Location data, through an option that’s turned on automatically when you give a post a location tag (only happens on some versions of TikTok);

Additionally, the app creates a local proxy server on your device, which is officially used for “transcoding media”. However, this is done without any form of authentication, making it susceptible to misuse….

We asked investigative journalist and writer Maria Genova about her vision on TikTok. … Genova says: “There’s a reason several countries have banned it. It’s unbelievable how much information an app like that pulls from your phone”…

TikTok needs access to your camera and microphone in order to work properly… However, there aren’t any specifications explaining how exactly these permissions are used. Therefore, TikTok could theoretically record conversations and sounds using your microphone, even when you aren’t filming a TikTok video.

We could go on and on with the technical details here, but you get the point. The fact that “IP addresses aren’t anonymized“ is really a big, bad deal. The article concludes:

The current findings and concerns surrounding TikTok are reason enough for us [the staff at VPNOverview] to remove the app from our devices. Whether TikTok’s main target group – young people between 14 and 25 – is sensitive to the privacy concerns that have come to light, remains to be seen.

Indeed.

One more quote , from Brendan Carr of the U.S. Federal Communications Commission (FCC), regarding the reliability of TikTok’s claims that they do not share data with the Chinese government:

“China has a national security law that compels every entity within its jurisdiction to aid its espionage and what they view as their national security efforts,” Carr said earlier this year, alluding to the fact that Chinese companies must make all the data they collect available to the Chinese Communist Party (CCP).

Stay tuned for Part 2, dealing with some larger market ramifications of TikTok’s evasion of  Apple and Android privacy protections.

~ ~ ~ ~ ~ ~ ~ ~ ~ ~ ~ ~ ~ ~ ~ ~ ~ ~ ~

This just in from BuzzFeed (added to original post here):

“Leaked Audio From 80 Internal TikTok Meetings Shows That US User Data Has Been Repeatedly Accessed From China”

For years, TikTok has responded to data privacy concerns by promising that information gathered about users in the United States is stored in the United States, rather than China, where ByteDance, the video platform’s parent company, is located. But according to leaked audio from more than 80 internal TikTok meetings, China-based employees of ByteDance have repeatedly accessed nonpublic data about US TikTok users — exactly the type of behavior that inspired former president Donald Trump to threaten to ban the app in the United States.

The recordings, which were reviewed by BuzzFeed News, contain 14 statements from nine different TikTok employees indicating that engineers in China had access to US data between September 2021 and January 2022, at the very least. Despite a TikTok executive’s sworn testimony in an October 2021 Senate hearing that a “world-renowned, US-based security team” decides who gets access to this data, nine statements by eight different employees describe situations where US employees had to turn to their colleagues in China to determine how US user data was flowing. US staff did not have permission or knowledge of how to access the data on their own, according to the tapes.

“Everything is seen in China,” said a member of TikTok’s Trust and Safety department in a September 2021 meeting.
A Dragonfly’s View of Election Day 2022

This is my last post before the US midterm elections on Tuesday, so I’ll leave you with a prediction for what’s coming.

Who is the best predictor of elections? Nate Silver at FiveThirtyEight has had a pretty good run since 2008 using weighted polls. Ray Fair, an economics professor at Yale has a venerable and well-credentialed model based on fundamentals. I typically favor prediction markets, because they incorporate a wide range of views weighted by how willing people are to put their money where their mouth is, and traders are able to incorporate other sources of information (including predictors like FiveThirtyEight). But which prediction market should we trust? There are now many large prediction markets, and the odds often differ substantially between them.

When there are many reasonable ways of answering a question or looking at a problem, it can be hard to choose which is best. Often the best answer is not to choose- instead, take all the reasonable answers and average them. Dan Gardner and Philip Tetlock call this approach Dragonfly Eye forecasting, since dragonfly’s eyes see through many lenses. So what does the dragonfly see here?

Lets start with the US House, since everyone covers it.

  • FiveThirtyEight’s latest forecast shows that Republicans have an 85% chance of taking the House; it shows a range of possible outcomes, but on average predicts that Republicans win the popular vote by 4.3% and take 231 House seats (substantially over the 218 needed for a majority)
  • The Fair Model predicts that Democrats will win 46.6% of the two-party vote share (leaving Republicans with 53.4%). This has Republicans winning the popular vote by 6.8%, a moderately bigger margin than FiveThirtyEight. The reasoning is interesting; the economy is roughly neutral since “the negative inflation effect almost exactly offsets the positive output effect”, so this is mainly from the typical negative effect of having an incumbent party in the White House.
  • Prediction markets: PredictIt currently gives Republicans a 90% chance to take the House. Polymarket gives them 87%. Insight Prediction also gives them 87%. Kalshi doesn’t have a standard market on this, but their contest (free to enter, 100k prize) predicts 232 Republican seats.

Its a bit tricky to average all these since they don’t all report on the same outcome in the same way. But the overall picture is clear: Republicans are likely to do well in the House, with an ~87% chance to win a majority, expected to win the popular vote by ~5.55% and take ~232 seats.

The Senate is closer to a coin flip and harder to evaluate.

  • FiveThirtyEight gives Republicans a 53% chance to win a majority (51+ seats for them; Democrats effectively win if the Senate stays 50-50 since a Democratic Vice President breaks ties for at least 2 more years). The most likely seat counts are 50-50 or 51-49, but confidence intervals are pretty wide and 54-46 either direction isn’t ruled out.
  • The Fair Model doesn’t make Senate predictions, only House and Presidential predictions.
  • Prediction markets: PredictIt gives Republicans a 70% chance to win a Senate majority, probably with 52-54 seats. PolyMarket gives Republicans a 65% chance, as does Insight Prediction. Kalshi predicts 53 Republican seats.

Overall we see a much higher variance of predictions in the Senate; a 17pp gap between the highest (70%) and lowest (53%) estimates of Republican chances, vs just a 5pp gap for the House (90% to 85%). This shows up with the seat counts too; everyone agrees there’s a substantial chance Republicans lose the Senate, but if they do win, it will probably be by more than one seat. The average estimate is ~52 Republican seats. FiveThirtyEight and PredictIt agree that the closest Senate races will be Georgia, Pennsylvania, Arizona, Nevada, and New Hampshire (though they rank order them differently), so those are the races to watch.

Forecasts for governors aren’t as comprehensive, but FiveThirtyEight predicts we’ll get about 28 Republican (22 Democratic) governors, while PredictIt expects 31+ Republicans; I’ll split the difference at 30. Everyone agrees that Oregon is surprisingly competitive because of an independent drawing Democratic votes. The biggest difference I see is on New York, where PredictIt gives Republican challenger Lee Zeldin a real chance (26%) but FiveThirtyEight doesn’t (3%).

Overall forecast: moderate red wave, Republicans take the House and most governorships, probably the Senate too. But if they lose anything it is almost certainly the Senate.

These forecasts seem about right to me. Democrats are weighed down by an unpopular (-11) President and the highest inflation in 40 years. This would lead to a huge red wave, but Republicans have their own weaknesses; an unpopular former President lurking in the background, and the Supreme Court making a big unpopular change voters blame them for. This shrinks the red wave, but I don’t think its enough to eliminate it. The effect of Roe repeal is fading with time, and the unpopular Biden is more salient than the unpopular Trump; Biden is the one in office and is more prominent in media coverage. Facebook and recently-acquired Twitter may be doing Republicans a favor by keeping Trump banned through Election day. But if he drags Republicans down anywhere, it will be the Senate, where candidate quality (not just party affiliation) is crucial and his endorsements pushed some weak/weird/extreme candidates through primaries. We’ll also see this “extremist” Trump effect (abetted by cynical Democratic donations to extreme-right candidates) dragging down Republicans in some key governor’s races like Pennsylvania, where Democrats are now 90/10 favorites..

An intervention for children to change perceptions of STEM

Here is a a new paper related to the topic of women getting into technical fields (see previous post on my paper about programming).

Grosch, Kerstin, Simone Haeckl, and Martin G. Kocher. “Closing the gender STEM gap-A large-scale randomized-controlled trial in elementary schools.” (2022).

These authors were thinking about the same problem at the same time, unbeknownst to me. In their introduction they write, “We currently know surprisingly little about why women still remain underrepresented in STEM fields and which interventions might work to close the gender STEM gap.”

My conclusion from my paper is that, by college age, subjective attitudes toward tech are very important. This leads to the questions of whether those subjective attitudes are shaped at younger ages. Grosch et al. have run an experiment to target 3rd-graders with a STEM-themed game. I’ll quote their description:

The treatment web application (treatment app) intends to increase interest in STEM directly by increasing knowledge and awareness about STEM professions and indirectly by addressing the underlying behavioral mechanisms that could interfere with the development of interest in STEM. The treatment app presents both fictitious and real STEM professionals, such as engineers and programmers, on fantasy planets. Accompanied by the professionals, the children playfully learn more about various societal challenges, such as threats from climate change and to public health, and how STEM skills can contribute to combating them. The storyline of the app comprises exercises, videos, and texts. The app also informs children about STEM-related content in general. To address the behavioral mechanisms, the app uses tutorials, exercises, and (non-monetary) rewards that teach children a growth mindset and improve their self-confidence and competitive aptitude. Moreover, the app introduces female STEM role models to overcome stereotypical beliefs. To test the app’s effect, we recruited 39 elementary schools in Vienna (an urban area) and Upper Austria (a predominantly rural area).

This is a preview of their results, although I recommend reading their paper to understand how these measurements were made:

Girls’ STEM confidence increases significantly in the treatment group (difference: 0.047 points or 0.28 standard deviations, p = 0.002, Wald test), and the effect for girls is significantly larger than the effect for boys.

Result 2: Children’s competitiveness is positively associated with children’s interest in STEM. We do not find evidence that stereotypical thinking and a growth mindset is associated with STEM interest.

Lastly, my kids play STEM-themed tablet games. PBS Kids has a great suite of games that are free and educational. Unfortunately, I have not tried to treat one kid while giving the other kid a placebo app, so my ability to do causal inference is limited.

The Only Analysis of the Pennsylvania Senate Debate That You Need To Read

Last night the major party candidates for Senate in Pennsylvania had their first and only debate. I didn’t watch it, since I don’t live in Pennsylvania. But judging by my Twitter feed, a lot of people did watch it, including (bizarrely to me) lots of people who don’t live in Pennsylvania. And overnight, tons of articles were written analyzing the debate, saying who “won” the debate, and so on (“5 Things You Need to Know About the Pennsylvania Senate Debate” etc.).

But this blog post is the only thing you need to read about that debate. And these charts are really all you need to look at.

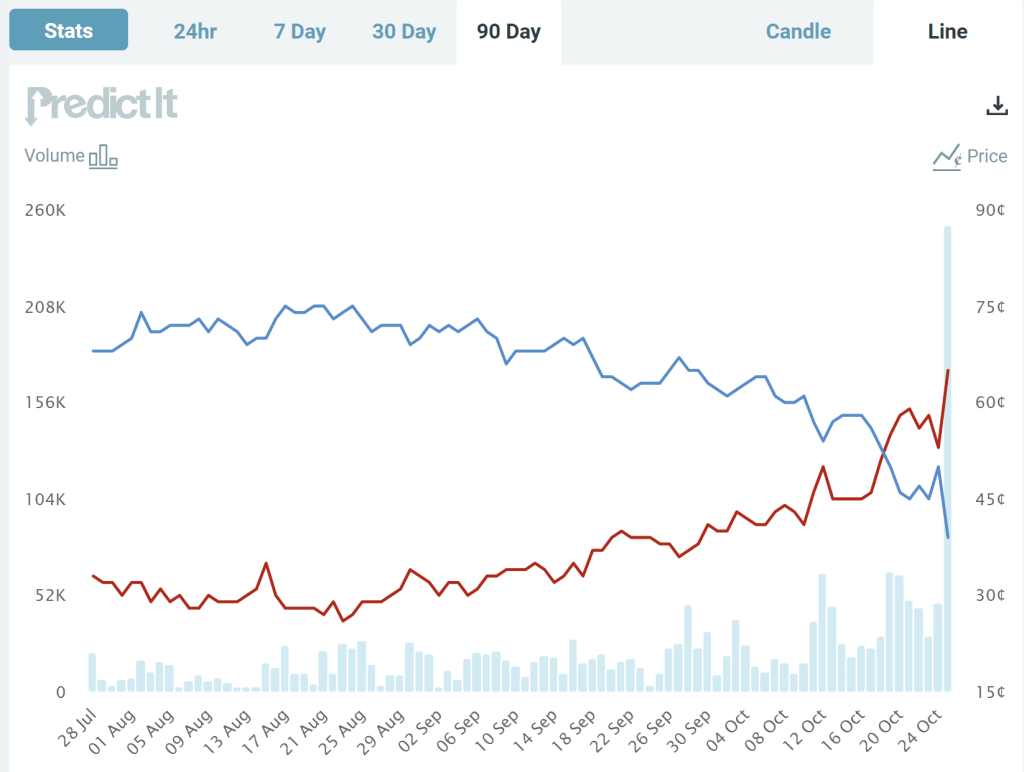
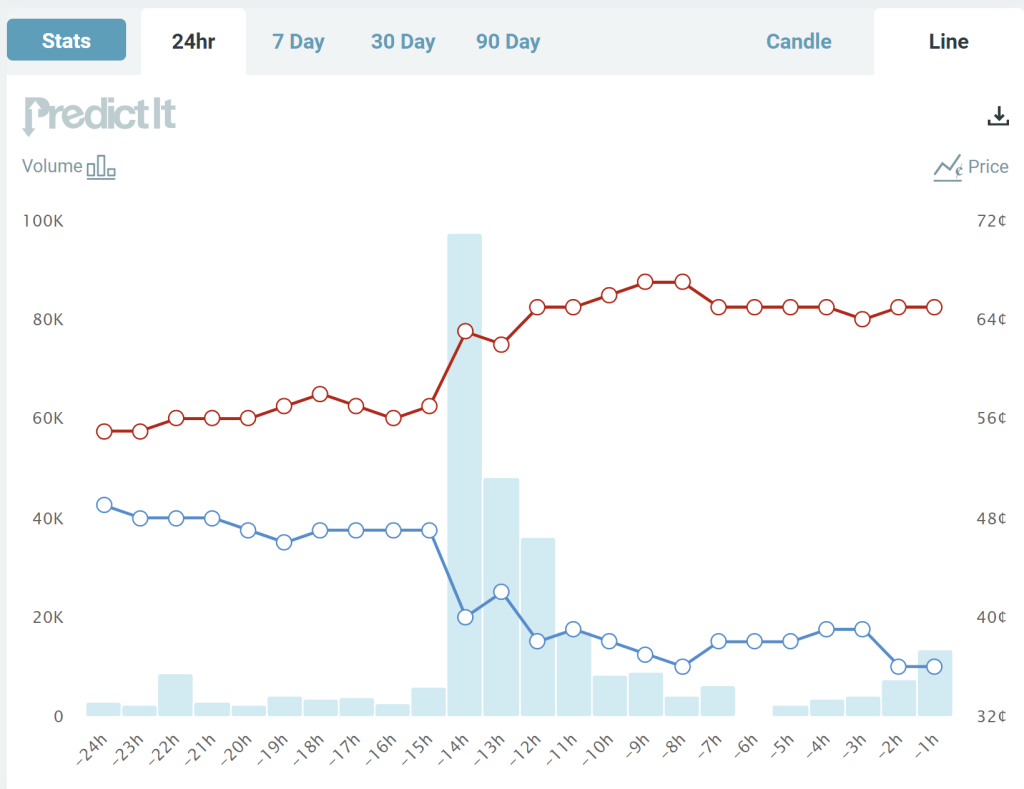
These two charts come from the prediction market website PredictIt. The charts show the “odds” (more on that below) that each candidate will win the Pennsylvania Senate race, over a 90-day time horizon (first chart) and the last 24 hours (second chart). What do we see? The Democratic candidate has been leading for the entire race up until a week ago, though with his odds falling gradually over the past month or two.

Notice though the big jump last night during the debate. The Republican candidate moved up from odds of about 57% to odds of about 63%, close to where it stands as I write (67%). Based on this result, it’s safe to say that the Republican candidate “won” the debate, though not so decisively that the election is now a foregone conclusion. You don’t need to wait for the polls, which have consistently showed the Democratic candidate in the lead (though with the gap closing in recent weeks) — though of course, these betting odds could change as new polling data is released.

But where do these odds come from?

Continue reading →

What do they even want?: Inflation Edition

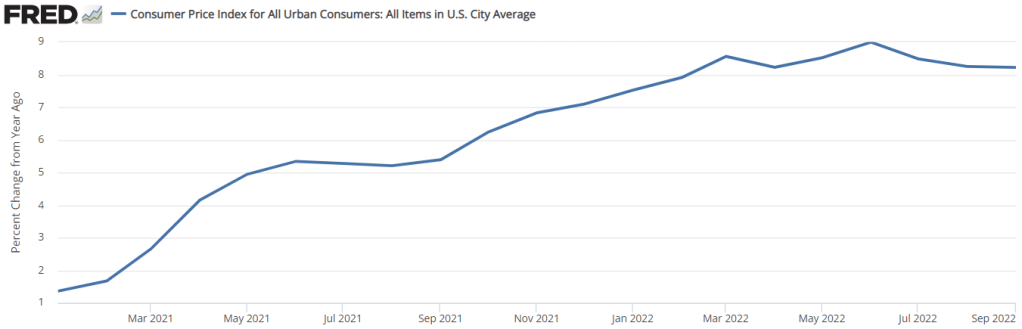
People were all excited last week when the CPI numbers were released because… the year-over-year rate of inflation did a whole lot of nothing. See below. The 12-month rate of inflation was practically constant. The 8.2% number was all over the headlines and twitter. We already know that news outlets don’t always report on the most relevant numbers. And I say that this is one of those times.

https://fred.stlouisfed.org/graph/?g=UQ4T

First of all, there is a problem with the year-over-year indicator. Well, not so much problem in the measure itself, but more a problem of interpretation. The problem is that the 12-month rate of inflation is the cumulative compound rate for 12 individual months. Each month that we update the 12-month inflation rate, we drop a month from the back of the 12-month window and we add a month to the front of the 12-month window. Below are both a graph and a table indicating the monthly rate of inflation and the 12-month periods ending in August 2022 (pink) and in September 2022 (green).

Continue reading →

Should Virologists Regulate Themselves?

Last Friday a group of researchers mostly from Boston University posted a paper which revealed they had created a new chimeric coronavirus and used it to infect mice.

We generated chimeric recombinant SARS-CoV-2 encoding the S gene of Omicron in the backbone of an ancestral SARS-CoV-2 isolate and compared this virus with the naturally circulating Omicron variant. The Omicron S-bearing virus robustly escapes vaccine-induced humoral immunity, mainly due to mutations in the receptor-binding motif (RBM), yet unlike naturally occurring Omicron, efficiently replicates in cell lines and primary-like distal lung cells. In K18-hACE2 mice, while Omicron causes mild, non-fatal infection, the Omicron S-carrying virus inflicts severe disease with a mortality rate of 80%. 

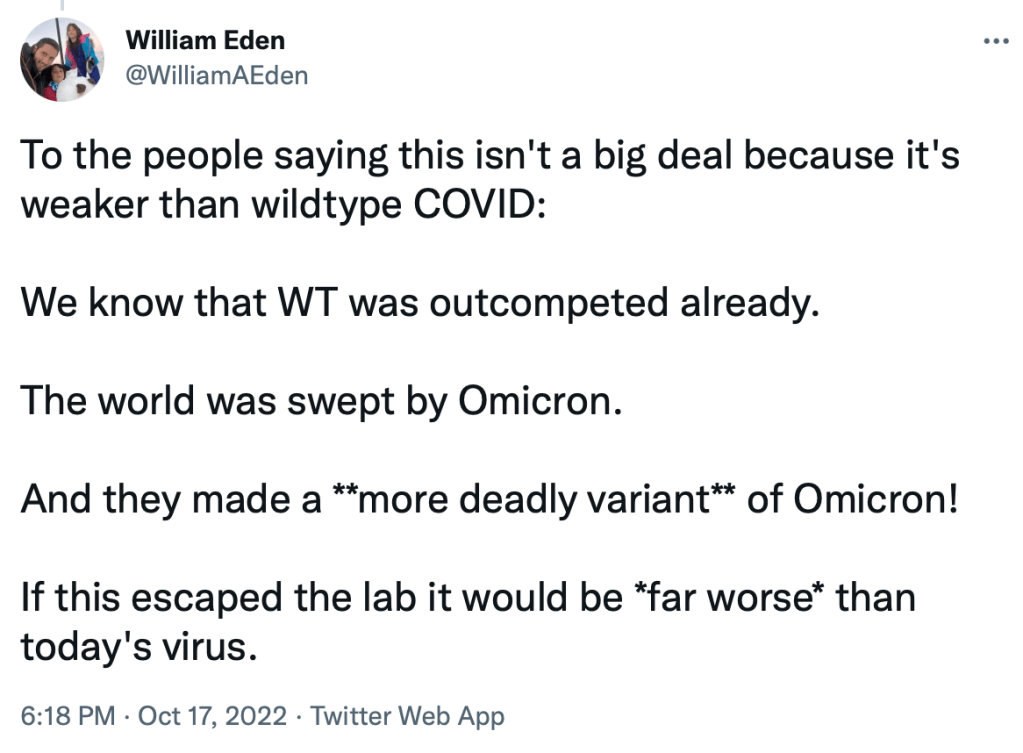
Many people who heard about this expressed concern that the risk of creating more contagious and/or deadly versions of Covid that could escape from a lab outweigh any potential benefits of what we could learn from this research.

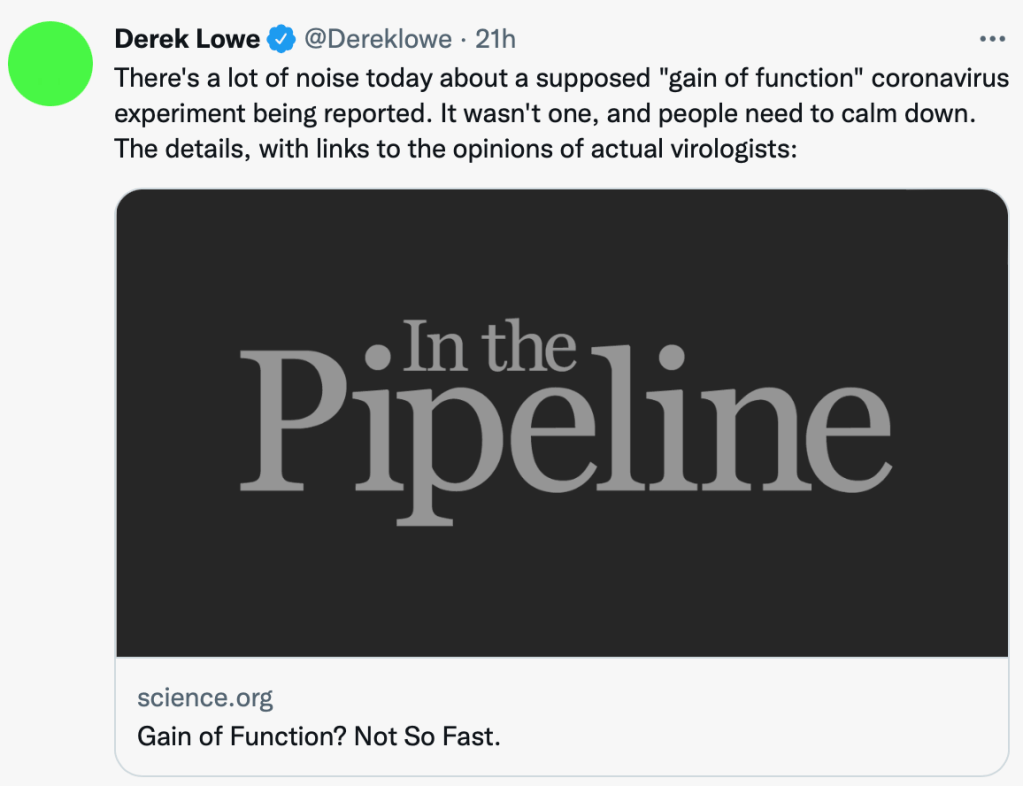
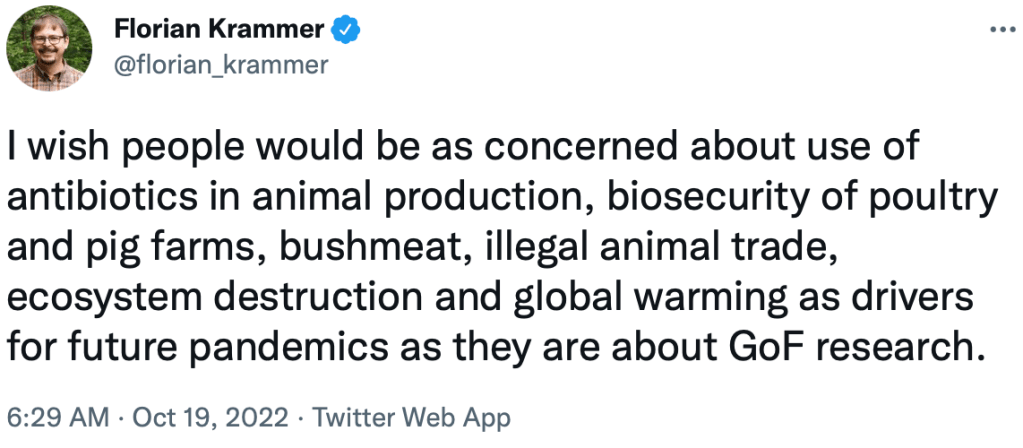
Several researchers have responded to these concerns with variants of “trust virologists to weigh the risks here, they know more than you.”

Don’t tell us virologists how to do our jobs; tell farmers, hunters, and veterinarians how to do theirs

Here’s the thing: the virologists do know the risks better than the public or potential regulators- but they also have different incentives. What I want to point out today is that virology isn’t special; this is true of just about every field. A nuclear engineer knows much more about what’s happening at their plant than voters do, or distant bureaucrats at the Nuclear Regulatory Commission. Should we leave it to the engineers on site to decide how much risk to take? Should federal regulators leave it to the financial experts at Bear Sterns and AIG to decide how much risk they can take?

To some extent I actually sympathize with these critiques; industry practitioners really do tend to have the best information, and voters often push regulatory agencies to be insanely risk-averse. With any profession this information problem is a reason to regulate less than you otherwise would, and/or pay to hire expert regulators.

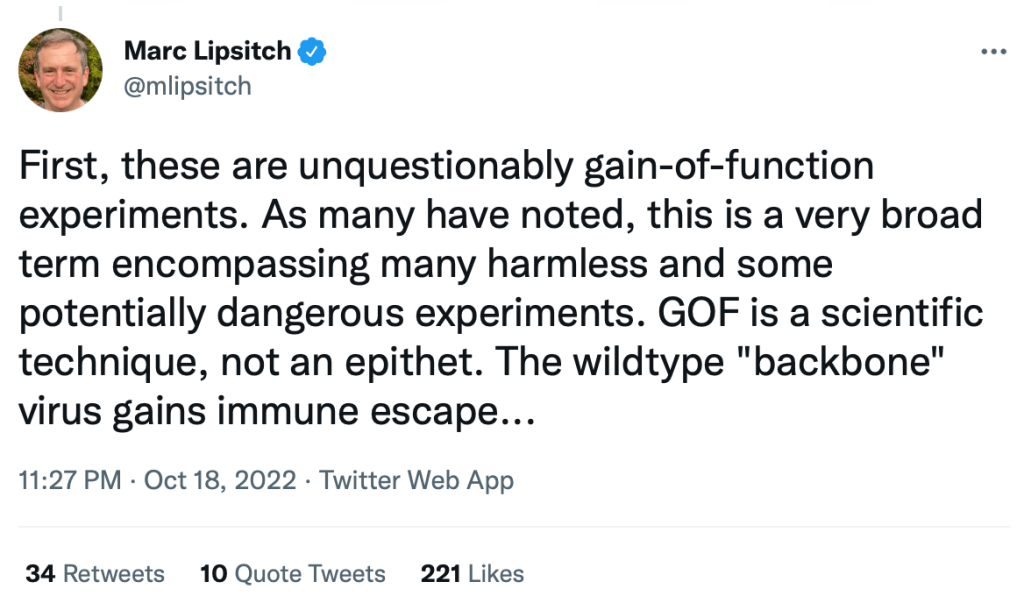
But externalities are real- the practitioners who have the best information use it to promote their own interests, which tend to differ from the interests of the public. In finance this means moral hazard at best and fraud at worst (who are you to say Bernie Madoff is a fraud? You know more about finance than him?). In medicine it means doctors who get paid more for doing more; they gave the guy who invented lobotomies a Nobel Prize in Medicine. In research that involves creating new viruses, researchers get the private benefits of prestige publications for themselves, but the increased pandemic risk is shared with the whole world. In this case its not just outsiders who are concerned, some subject-matter experts are too (and not just “usual suspects” Alina Chan and Richard Ebright; see also Marc Lipsitch).

The main current check on research like this is supposed to be Institutional Review Boards. The chimeric Covid paper notes “All procedures were performed in a biosafety level 3 (BSL3) facility at the National Emerging Infectious Diseases Laboratories of the Boston University using biosafety protocols approved by the institutional biosafety committee (IBC)”. But there are many problems with this approach. The IRB is run by employees of the same institution as the researcher, the institution that also claims a disproportionate share of the benefits of the research.

IRBs are also incredibly opaque. The paper claims it was approved by Boston University’s institutional biosafety committee, but these committees don’t maintain public lists of approved projects; I e-mailed them Sunday to ask if they actually approved this project and they have yet to respond. There is also no public list of the members of these committees, although in BU’s case you can get a good idea of who they are by reading the meeting minutes. This chimeric Covid proposal appears to have been reviewed as the second proposal of their January 2022 meeting, reviewed by Robert Davey and Shannon Benjamin and approved by a 16-0 vote of the committee. During the January meeting the committee approved all 6 projects they considered unanimously, after hearing 6 reports of lab workers at BU being exposed to lab pathogens in the previous month, e.g.:

MD/PhD student reported experiencing low grade temperatures and other symptoms after he accidentally injured his thumb percutaneously on 12-6-21 while cleaning forceps that he had used to remove infected lungs from mice injected with NL63 virus

IRBs are supposed to protect research subjects from harm, but in practice largely serve to protect their institutions from lawsuits and PR disasters (part of why they’re often too strict). The fact that this did get institutional approval provides one silver lining here; if this chimeric Covid ever did escape and cause an outbreak, those infected by it could potentially sue for damages not only the individual researchers, but Boston University and its $3.4 billion endowment. Being able to internalize externalities in this way is one of many good reasons to be testing those infected with Covid to see what variant they have.

I think we should at least consider stronger national regulations against research like this, rather than leaving each decision to local institutional review boards (ask any researcher how much they trust IRBs). At the very least we should stop subsidizing it; NIH claims they don’t fund “gain of function” research like this, but the researchers who made a new version of Covid conclude their paper:

This work was supported by Boston University startup funds (to MS and FD), National Institutes of Health, NIAID grants R01 AI159945 (to SB and MS) and R37 AI087846 (to MUG), NIH SIG grants S10- OD026983 and SS10-OD030269 (to NAC)

Mortgage Affordability Since 1971

Mortgage interest rates are climbing quickly, while housing prices are still mostly high. These factors combined means that it is much more expensive to buy a home than in the recent past. But how much more expensive? And how does this compare with the past 50 years of history?

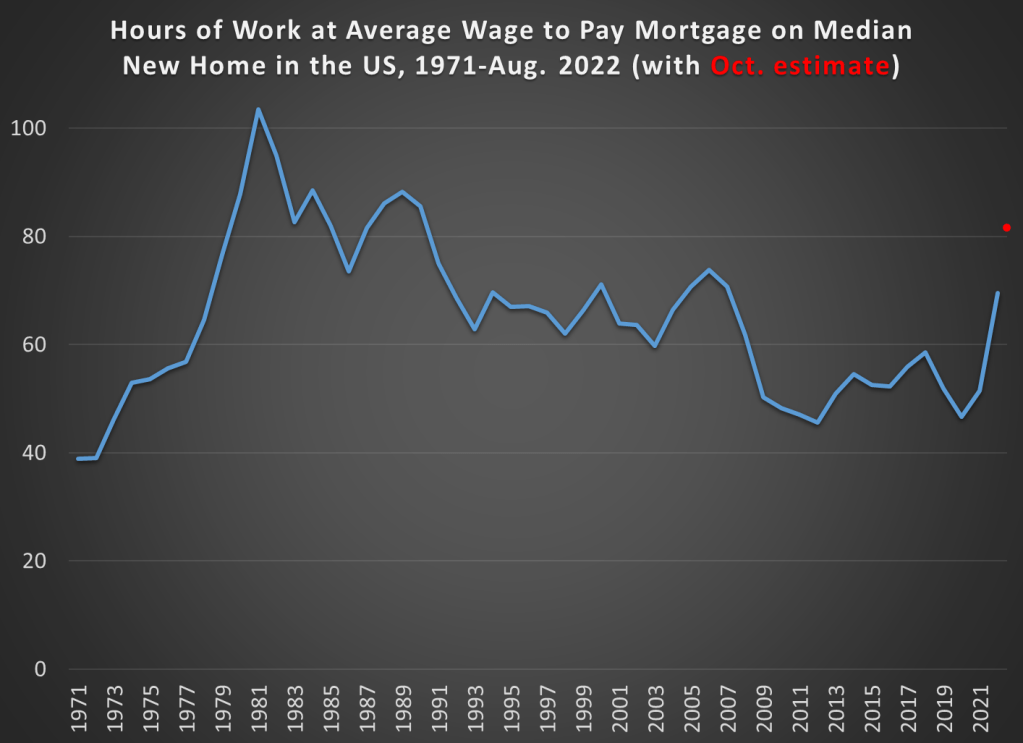
The chart below is my attempt to answer those questions. It shows the number of hours you would need to work at the average wage to make a mortgage payment (principal and interest) on the median new home in the US.

My goal here was to provide the most up-to-date estimate of this number consistent with the historical data. Thus, I had to use average wage data rather than median wage data, since the median hourly wage data is not available for 2022 yet. But as I’ve discussed before, while median and average wages are different, their rate of increase is roughly the same year-to-year, so it would show the same trends.

The final point plotted on the blue line in the chart is for August 2022, the last month for which we have median home price data, average wage data, and 30-year mortgage rates. Mortgage rates are the yearly average (or monthly average in the case of August 2022).

You’ll also notice a red dot at the very end of the series. This is my guess of where the line will be in October 2022, once we have complete data for these three variables (right now only mortgage rates are available in October for the three series I am using). I’m doing my best here to provide as much of a real-time picture as possible, given that rates are rising very sharply right now, while still providing consistent historical comparisons. If that estimate is roughly correct, mortgage costs on new homes are now less affordable than any year since 1990.

What do you notice in the chart?

Continue reading →

Willingness to be Paid Treatments

This is the second of two blog posts on my paper “Willingness to be Paid: Who Trains for Tech Jobs”. Follow this link to download the paper from Labour Economics (free until November 27, 2022).

Last week I focused on the main results from the paper:

  • Women did not reject a short-term computer programming job at a higher rate than men.
  • For the incentivized portions of the experiment, women had the same reservation wage to program. Women also seemed equally confident in their ability after a belief elicitation.
  • The main gender-related outcomes were, surprisingly, null results. I ran the experiment three times with slightly different subject pools.
  • However, I did find that women might be less likely to pursue programming outside of the experiment based on their self-reported survey answers. Women are more likely to say they are “not confident” and more likely to say that they expect harassment in a tech career.
  • In all three experiments, the attribute that best predicted whether someone would program is if they say they enjoy programming. This subjective attitude appears more important even than having taken classes previously.
  • Along with “enjoy programming” or “like math”, subjects who have a high opportunity cost of time were less willing to return to the experiment to do programming at a given wage level.

I wrote this paper partly written to understand why more people are not attracted to the tech sector where wages are high. This recent tweet indicates that, although perhaps more young people are training for tech than ever before, the market price for labor is still quite high.

The neat thing about controlled experiments is that you can randomly assign treatment conditions to subjects. This post is about what happened after adding either extra information or providing encouragement to some subjects.

Informed by reading the policy literature, I assumed that a lack of confidence was a barrier to pursuing tech. A large study done by Google in 2013 suggested that women who major in computer science were influenced by encouragement.

I provided an encouraging message to two treatment groups. The long version of this encouraging message was:

If you have never done computer programming before, don’t worry. Other students with no experience have been able to complete the training and pass the quiz.

Not only did this not have a significant positive effect on willingness to program, but there is some indication that it made subjects less confident and less willing to program. For example, in the “High Stakes” experiment, the reservation wage for subjects who had seen the encouraging message was $13 more than for the control subjects.

My experiment does not prove that encouragement never matters, of course. Most people think that a certain type of encouragement nudges behavior. My results could serve as a cautionary tale for policy makers who would like to scale up encouragement. John List’s latest book The Voltage Effect discusses the difficulty of delivering effective interventions at scale.

The other randomly assigned intervention was extra information, called INFO. Subjects in the INFO treatment saw a sample programming quiz question. Instead of just knowing that they would be doing “computer programming,” they saw some chunks of R code with an explanation. In theory, someone who is not familiar with computer programming could be reassured by this excerpt. My results show that INFO did not affect behavior. Today, most people know what programming is already. About half of subjects said that they had already taken a class that taught programming. Perhaps, if there are opportunities for educating young adults, it would be in career paths rather than just the technical basics.

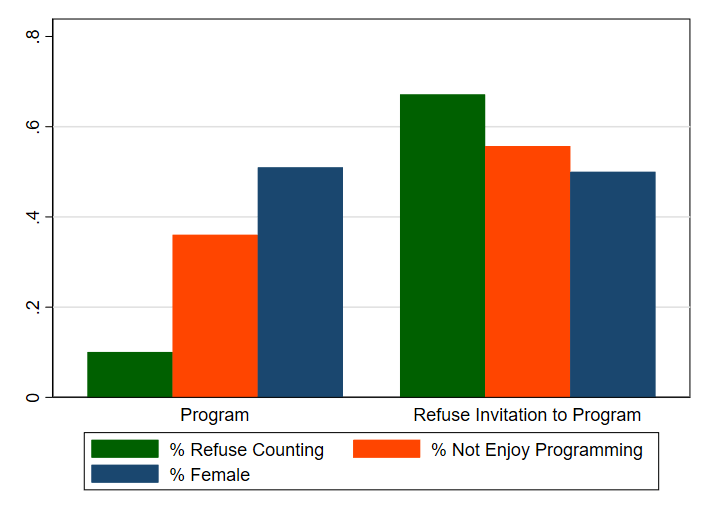
Since the differences between treatments turned out to be negligible, I pooled all of my data (686 subjects total) for certain types of analysis. In the graph below, I group every subject as either someone who accepted the programming follow-up job or as someone who refused to return to program at any wage. Recall that the highest wage level I offered was considerably higher on a per-hour basis than what I expect their outside earning option to be.

Fig. 5. Characteristics of subjects who do not ask for a follow-up invitation, pooling all treatments and sample

I’ll discuss the three features in this graph in what appear to be the order of importance for predicting whether someone wants to program. There was an enormous difference in the percent of people who were willing to return for an easy tedious task that I call Counting. By inviting all of these subjects to return to count at the same hourly rate as the programming job, I got a rough measure of their opportunity cost of time. Someone with a high opportunity cost of time is less likely to take me up on the programming job. This might seem very predictable, but this is a large part of the reason why more Americans are not going into tech.

Considering the first batch of 310 subjects, I have a very clean comparison between the programming reservation wage and the reservation wage for counting. People who do not enjoy programming require a higher payment to program than they do to return for the counting job. Self-reported enjoyment is a very significant factor. The orange bar in the graph shows that the majority of people who accepted the programming job say that they enjoy programming.

Lastly, the blue bar shows the percent of female subjects in each group. The gender split is nearly the same. As I show several ways in the paper, there is a surprising lack of a gender gap for incentivized decisions.

I hope that my experiment will inspire more work in this area. Experiments are neat because this is something that someone could try to replicate with a different group of subjects or with a change to the design. Interesting gaps could open up between subject types under new circumstances.

The topic of skill problems in the US represents something reasonably new for labor market and public policy discussions. It is difficult to think of a labor market issue where academic research or even research using standard academic techniques has played such a small role, where parties with a material interest in the outcomes have so dominated the discussion, where the quality of evidence and discussion has been so poor, and where the stakes are potentially so large.

Cappelli, PH, 2015. Skill gaps, skill shortages, and skill mismatches: evidence and arguments for the United States. ILR Rev. 68 (2), 251–290.