The Cost of Raising a Child

Raising kids is expensive. As an economist, we’re used to thinking about cost very broadly, including the opportunity cost of your time. Indeed, a post I wrote a few weeks ago focused on the fact that parents are spending more time with their kids than in decades past. But I want to focus on one aspect of the cost, which is what most “normal” people mean by “cost”: the financial cost.

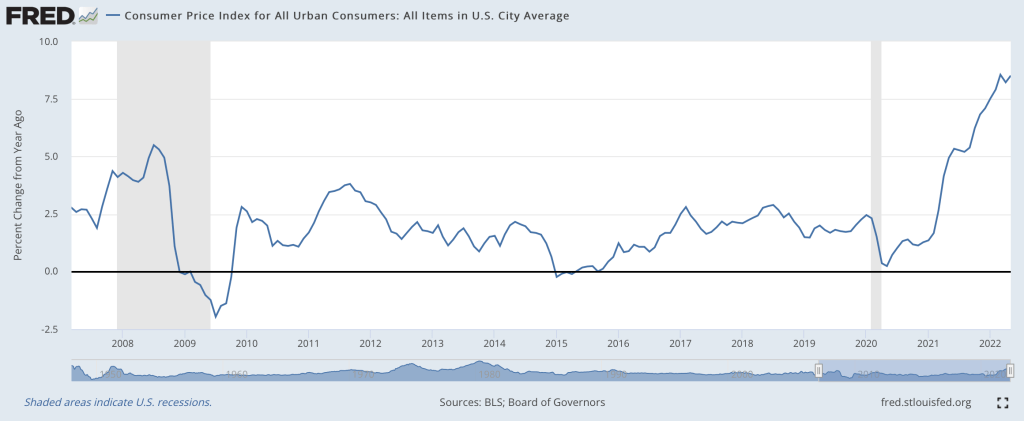
Conveniently, the USDA has periodically put out reports that estimate the cost of raising a child. Their headline measure is for a middle-income, married couple with two children. Unfortunately the last report was issued in 2017, for a child born in 2015. And in the past 2 years, we know that the inflation picture has changed dramatically, so those old estimates may not necessarily reflect reality anymore. In fact, researchers at the Brookings Institution recently tried to update that 2015 data with the higher inflation we’ve experienced since 2020. In short, they assumed that from 2021 forward inflation will average 4% per year for the next decade (USDA assumed just over 2%).

Doing so, of course, will raise the nominal cost of raising a child. And that’s what their report shows: in nominal terms, the cost of raising a child born in 2015 will now be $310,605 through age 17, rather than $284,594 as the original report estimated. The original report also has a lower figure: $233,610. That’s the cost of raising that child in 2015 inflation-adjusted dollars.

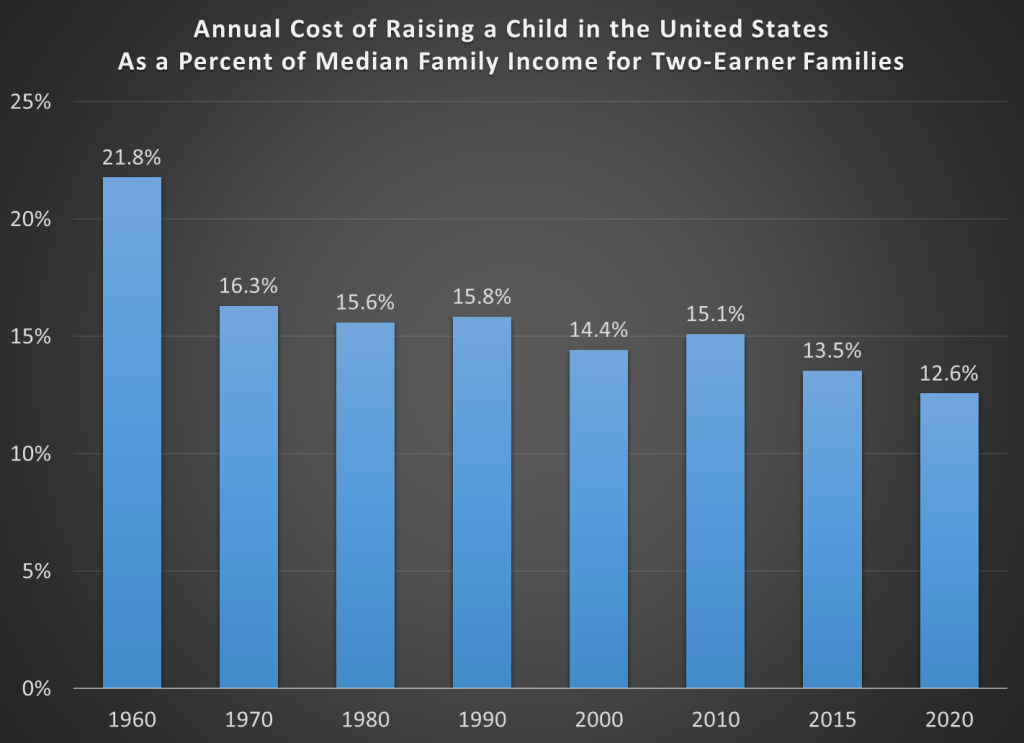
As I’ve written several times before on this blog, adjusting for inflation can be tricky. In fact, sometimes we don’t actually need to do it! To see if it is more or less expensive to raise a child than in the past, what we can do instead is compare to the cost to some measure of income. I will look at several measures of income and wages in this post, but let me start with the one I think is the best: median family income for a family with two earners. Why do I think this is best? Because the USDA and Brookings cost estimates are for married couples who are also paying for childcare. To me, this suggests a two-earner family is ideal (you may disagree, but please read on).

Here’s the data. Income figures come from Census. Child costs are from USDA reports in 1960-2015, and the Brookings update in 2020.

Continue reading

GDP Growth and Inflation in G7 Countries

Back in April I wrote about GDP growth rates and inflation rates in G7 countries and the OECD broadly. James also wrote about a broader set of countries (182!) using these two measures. Since the economic scene is evolving so quickly, and we now have 6 more months of data, I wanted to provide an update on the US and our other large peer nations.

Here’s the data, showing cumulative real GDP growth and cumulative core inflation since the right before the pandemic (please note that I flipped the x- and y-axis from the previous post — sorry for the confusion, but this way makes more sense).

The picture looks roughly the same, but here are a few notable changes:

  • Despite the slight slowdown in GDP growth in the first half of 2022, the US still clearly has the highest rate of economic growth
  • UK, Italy, and Canada have now moved into positive territory for cumulative economic growth (yes, it’s all inflation adjusted)
  • But Japan and Germany still have had no net economic growth during the pandemic — and even worse for Germany, they have had a healthy dose of inflation too

The US once again stands out as having both the best economic performance and the worst inflation performance in the G7. Are these two things connected? That’s a question that is unanswerable from a simple scatterplot, and may be unanswerable completely. But I think it’s fair to say that the US hasn’t taken an obviously inferior economic path relative to other countries, even if our path has been inferior compared to some ideal policy. But don’t commit the Nirvana Fallacy!

Finally, we should recognize that the GDP is not the only important measure of how an economic is performing. For example, the US labor market has not recovered as well as some other peer nations have. Still, GDP is one of the important broad measures to look at, even if it is not ideal for diagnosing recessions.

Free download: If wages fell during a recession

You can download my full paper “If Wages Fell During a Recession” with Dan Houser from the Journal of Economic Behavior and Organization (only free until September 24, 2022).

There is a simulated recession in our experiment. We ask what happens if employers cut wages in response. Although nominal wage cuts are rare in the outside world, some of our lab subjects cut the wages of their “employee”. Employees retaliated against nominal wage cuts by shirking, such that the employers probably would have been better off keeping wages rigid.

We also tried the same thing with an inflation shock that allowed the employer to institute a real wage cut without a nominal wage cut. The reaction to that real wage cut was muted compared to the retaliation against the obvious nominal wage cut.

Inflation was implemented after 3 rounds of the same wage to create a reference point.

I blogged about the experiment previously, so I won’t go into more detail here.

The Great Recession happened when I was an undergraduate. As I started my career in research, the issue of employment and recessions seemed like THE problem to work on. The economy of 2022 is so different from the years that inspired this experiment! Below I’ll highlight current events and work from others on this topic.

Inflation used to be something Americans could almost ignore, and now it’s at the highest level I have seen in my lifetime. Suddenly, people are so mad about inflation that politicians named their bill the Inflation Reduction Act just to make it popular.  

The EWED crew has made lots of good posts on inflation. Although job openings and (nominal) wage increases are noticeable right now, Jeremy explored whether inflation has wiped out apparent wage growth.

More recently, the WSJ reports that real wages are down because inflation is so high. “Wage gains haven’t kept pace with inflation. Private-sector wages and salaries declined 3.1% in the second quarter from a year earlier, when accounting for inflation.”

Firms in 2022 did not just sit back and let real wages get eroded exactly proportional to inflation. But it is also not the case that Americans got a raise of 9% to exactly offset inflation. According to our experiment, there would be outrage if workers were experiencing a nominal wage cut in proportion to the real wage cut they are getting right now.

The high inflation combined with a hot job market makes this current economy hard to compare to anything in our recent history. Brian at Price Theory explained that inflation pressure is coming from both supply and demand factors.

Joey has a nice graph on inflation composition.

Did anyone see this coming? Watch Jim Doti of Chapman University predict high inflation based on the money supply in his forecast back in July 2021.

Lastly, our experiment on wage cuts has been cited in these papers:

Intentions rather than money illusion – Why nominal changes induce real effects

Economic stability promotes gift-exchange in the workplace

Wage bargaining in a matching market: Experimental evidence

Can reference points explain wage rigidity? Experimental evidence

Shocking gift exchange

Recession or not, the biggest GDP political football is 3 months away

US GDP fell for the second straight quarter according to statistics released this week by the Bureau of Economic Analysis. This means that by one common definition we’re now in a recession, which has ignited a debate about whether “two consecutive quarters of negative GDP growth” is the best definition (as opposed to ‘when the NBER says there’s one’, like I generally teach and Jeremy argued for here, or something else).

Naturally this debate has political overtones, since the party in power would be blamed for a recession, so we’ve seen the White House CEA argue that we’re not in a recession, many on the other side argue that we are, and plentiful hypocrisy from people who should know better.

But in political terms, the fight over the binary “are we in a recession” call won’t be the big economic factor in November’s elections- that will be inflation and GDP, especially 3rd quarter GDP. One of the oldest and best predictors of US elections is the Fair Model, which uses inflation and the number of recent “strong growth quarters”. Fair’s update following the recent Q2 GDP announcement states:

the predicted vote share for the Democrats is 46.70, which compares to 48.99 in October. The smaller predicted vote share for the Democrats is due to two fewer strong growth quarters and slightly higher inflation

By Election Day we’ll have 3 more months of economic data making it clear whether inflation is getting under control and whether economic activity is picking back up or continuing to decline. Monthly data releases on inflation and unemployment will be closely watched, but the most discussed release will likely be third quarter GDP. It will summarize 3 months instead of just one, it will be of huge relevance to the debate over how severe the recession is or whether we’re even in one, and it will likely be released less than two weeks before election day. The NBER almost certainly won’t weigh in by then; they tend to take over a year to date recessions, not adjudicate debates in real time.

So when BEA does release their Q3 GDP estimate in late October, what will it say? Markets currently estimate at least a 75% chance it will be positive (they had estimated a 36% chance of positive Q2 GDP just before the latest announcement). That sounds high to me, the yield curve is still inverted and I bet investment will continue to drag, but forecasting exact GDP numbers is hard. Its a much easier bet that whatever the number turns out to be will loom large in political debates just before the elections. Perhaps we’ll get the Q3 GDP growth number that would make for the most chaotic debate: 0.0%.

Are We in A Recession?

The truth is, we don’t know. But let’s be clear: whether we are or not doesn’t depend on the 2nd quarter GDP report. Though two consecutive quarters of declining GDP is often cited as the definition of a recession, it’s not the definition economists use. And with good reason.

Instead, the NBER Business Cycle Dating Committee uses this definition: “a significant decline in economic activity that is spread across the economy and that lasts more than a few months.” And they explain why GDP is not their preferred measure, which includes several reasons but this one seems most germane to our current moment: “[the] definition includes the phrase, ‘a significant decline in economic activity.’ Thus real GDP could decline by relatively small amounts in two consecutive quarters without warranting the determination that a peak had occurred.”

If not GDP, what do they look at? I’ll get into more detail later, but in short, they look at monthly measures of income, consumption, employment, sales, and production (a direct measure of production, which GDP is not — it’s a proxy).

However, the American public seems convinced that we are in a recession. The most recent poll I can find on this is from mid-June, which is useful because (as we’ll see below) we have most of the relevant measures of the economy for June 2022 already. In that poll, 56% of Americans say we are in a recession. And while there is some partisan bent to the responses, even 45% of Democrats seem to think we are in a recession. For those that say we are in a recession, 2/3 cite inflation as the primary indicator that we are in a recession.

Already here we can see the difference between the general public and NBER: the rate of inflation is not one of the measures that NBER considers when defining a recession. So, what are the measures they use?

Continue reading

Market Concentration & Inflation

We are living in volatile times. With covid-19, big federal legislation packages, and the Ruso-Ukrainian conflict disruptions to grain, seed oils, and crude oil, relative prices are reflecting sudden drastic ebbs of supply and demand. I want to make a small but enlightening point that I’ve made in my classes, though I’m not sure that I’ve made it here.

Economists often get a bad rap for being heartless or unempathetic. Sometimes, they are painted as ideologues who just disguise their pre-existing opinions in painfully specific terminology and statistics. Let’s do a litmus test.

Consider two alternative markets. One is a perfect monopoly, the other has perfect competition. All details concerning marginal costs to firms and marginal benefits to consumers are the same. In an erratic world, which market structure will result in greater price volatility for consumers? Try to answer for yourself before you read below. More importantly, what’s your reasoning?

Extreme Market Power

A distinguishing difference between a competitive market and a monopoly concerns prices. While firms maximize profits in both cases, the price that consumers face in a competitive market is equal to the marginal cost that the firms face. There is no profit earned on that last unit produced. In the case of monopoly, the price is above the marginal cost. Profits can be positive or negative, but the consumer will pay a price that is greater than the cost of producing the last unit.

Below are two graphs. Given identical marginal costs of production and benefits that the consumers enjoy, we can see that:

  1. The monopoly price is higher.
  2. The monopoly quantity produced is lower.

But static models only go so far. What about when there is volatility in the world?

Volatile Costs

Oil and gasoline are important inputs for producing many (most?) physical goods. Not only that, they are short-lived, meaning that they disappear once they are used, making them intermediate goods. Therefore, changes in the price of oil constitutes a change in the marginal cost for many firms. If the price of oil rises, or is volatile otherwise, then which type of market will experience greater price and quantity volatility?

Below are two figures that illustrate the same change in the marginal cost. We can see that:

  1. Monopoly price volatility is lower (in absolute terms and percent).
  2. Monopoly quantity produced volatility is lower (in absolute terms, though no different as a percent).

The take-away: While monopoly does constrict supply and elevate prices, Monopoly also reduces price and output volatility when there are changes in the marginal cost.  

Volatile Demand

That covers the costs. But what about volatile demand? A large part of the Covid-19 recession was the huge reallocation of demand away from in-person services and to remote services and goods. What is the effect of market power when people suddenly increase or decrease their demand for goods?

Below are two figures that illustrate the same change in demand. We can see that:

  1. Monopoly price volatility is higher (in absolute terms, though no different as a percent).
  2. Monopoly quantity produced volatility is lower (in absolute terms, though no different as a percent).

Monopolies Don’t Cause Inflation

Economists know that inflation can’t very well be blamed on greed (does less greed beget deflation?). Another problematic story is that market concentration contributes to inflation. But the above illustrations demonstrate that this narrative is also a bit silly. Monopolistic markets cause the price level to be higher, it’s true. But inflation is the change in prices. Changing market concentration might be a long term phenomenon, but can’t explain acute price growth. If demand suddenly rises, monopolies result in no more price growth than perfectly competitive markets. If the marginal cost of production suddenly rises, monopolies result in less price growth.

All of this analysis entirely ignores welfare. Also, no market is perfectly competitive or perfectly monopolistic. They are the extreme cases and particular markets lie somewhere in between.

Did you guess or reason correctly? Many econ students have a bias that monopolies are bad. So, in any side-by-side comparison, students think that “monopolies-bad, competition-good” is a safe mantra. But the above illustrations (which can be demonstrated mathematically) reveal that economic reasoning helps to reveal truths about the world. Economists are not simply a hearty band of kool-aid drinking academics.

Inflation for Thee, But Temporarily Not for FL

On May 6, 2022, the governor of Florida, Ron DeSantis, signed House Bill 7071. The bill was touted as a tax-relief package for Floridians in order to ease the pains caused by inflation. In total, the bill includes $1.2 billion in forgone tax revenues by temporarily suspending sales taxes that are levied on a variety of items that pull at one’s heartstrings. Below is the list of affected products.

A minor political point that I want to make first is that the children’s items are getting a lot of press, but they are only about 18.4% of the tax expenditures. The tax break on hurricane windows and doors received 37% of the funds and gasoline is receiving another 16.7%. There are ~$150 million in additional sales, corporate, and ad valorem tax exemptions. Looking at the table, it seems that producers of hurricane windows and doors might be the biggest beneficiary and that that the children’s items are there to make the bill politically palatable. Regardless, this is probably not the best use of $1.2 billion.


There are at least three economic points worth making.

Continue reading

Is this the peak of inflation?

I think so, though the path back to 2% is a long one. Two months ago I wrote that “the Fed is still under-reacting to inflation“. We’ve had an eventful two months since; last Friday the BLS announced CPI prices rose 1% just in May, and that:

The all items index increased 8.6 percent for the 12 months ending May, the largest 12-month increase since the period ending December 1981

Then this Wednesday the Fed announced they were raising interest rates by 0.75%, the biggest increase since 1994, despite having said after their last meeting that they weren’t considering increases above 0.5%. I don’t like their communications strategy, but I do like their actions this month. This change in the Fed’s stance is one reason I think we’re at or near the peak.

Its not just what the Fed did this week, its the change in their plans going forward. As of April, the Fed said the Fed Funds rate would be 1.75% in December, and markets thought it would be 2.5%. But now the Fed and markets both project 3.5% rates in December.

The other reason I’m optimistic is that the days of rapid money supply growth continue to get further behind us. From March to May 2020, the M2 and M3 supply exploded, growing at the fastest pace in at least 40 years:

Rapid inflation began about 12 months later. But the rate of money supply growth peaked in February 2021, then began a rapid decline. Based on the latest data from April 2022, money supply growth is down to 8%, a bit high but finally back to a normal range. Money supply changes famously influence prices with “long and variable lags”, so its hard to call the top precisely. But the fact that we’re now 15 months past the peak of money supply growth (and have stable monetary velocity) is encouraging. Old-fashioned money supply is the same indicator that led Lars Christiansen to predict this high inflation in April 2021 after successfully predicting low inflation post-2009 (many people got one of those calls right, but very few got both).

Stocks also entered an official bear market this week (down 20% from highs), which is both a sign of excess money no longer pumping up markets, and a cause of lower demand going forward.

Markets seem to agree with my update: 5-year breakevens have fallen from a high of 3.6% back in March down to 2.9% today, implying 2.9% average inflation over the next 5 years. Much improved, though as I said at the top the path to 2% will be a long one- think years, not months. Even the Fed expects inflation to be over 5% at the end of this year, and for it to fall only to 2.6% next year.

What am I still worried about? The Producer Price Index is still growing at 20%. The Fed is raising rates quickly now but their balance sheet is still over twice its pre-Covid level and is shrinking very slowly. The Russia-Ukraine war drags on, keeping oil and gas prices high, and we likely still have yet to see its full impact on food prices. Making good predictions is hard.

While I’m sticking my neck out, I’ll make one more prediction, though this one is easier- Dems are in for a bad time in November. A new president’s party generally does badly at his first midterm, as in 2018 and 2010. But this time the economy will be a huge drag on top of that. November is late enough that the real economy will be notably slowed by the Fed’s inflation-fighting effects, but not so late that inflation will be under control (I expect it to be lower than today but still above 5%). Markets currently predict a 75% chance that Republicans take the House and Senate in November, and if anything that seems low to me.

Raging Inflation, Spiking Rates, Plunging Stocks, Oh, My!

It has been such a volatile couple of days in the markets that you hardly know where to focus.  Friday’s inflation print was 8.6% (year/year), higher than expected and the highest in forty years, showing (yet again) that the Fed’s “transitory inflation” line was always just fantasy. Despite its glacial, foot-dragging pace of response to date, the Fed will need to raise short-rates (which they directly control) faster and farther than earlier planned. The Fed does not directly control long-term rates, but they influence them by buying and selling bonds on the open markets. For years, they have been buying bonds (driving interest rates lower), but they will have to stop that and maybe go the other way, being net sellers of bonds.  This will make financing government deficits much more difficult.

Anyway, both short and long term rates have gone vertical in the past few days as markets price in all this, reaching levels not seen since the aftermath of the 2008 Global Financial Crisis:

Rates of U. S. 1-Year Bills. From Wolf Richter.

Rates of U. S. 10-Year Notes. From Wolf Richter.

https://seekingalpha.com/article/4518160-treasury-bonds-plunge-yields-spike-stock-crypto-mess

Mortgage rates will likely march even further upward, increasing the monthly payments for most homeowners. At some point, this will deflate the housing market. Some of today’s eager new homebuyers who paid over asking price, assuming that housing only goes up, may be in for a rude awakening.

It seems like the only way to tamp down inflation is old-fashioned demand destruction. Stock market participants are starting to price in the dreaded R-word (recession). The plunging stock market has been in the news the last few days. Yes, it has dropped a lot, but shown on a five-year chart below it may not be so apocalyptic. It is dropping from ridiculously over-optimistic market highs at the end of 2021.  We are still slightly above the pre-COVID peak:

S&P 500 Index. From Seeking Alpha.

If you are young and working, you should see lower prices as a buying opportunity. If you are making regular contributions to a savings plan in stocks (dollar cost averaging), your dollars are buying you more stocks. If you feel you must DO something, you could always rebalance your portfolio, shifting some funds into stocks from something else, to maintain a say 70/30 stock/bond portfolio. Peace…

Not so Great Expectations

People have expectations about the world. When those expectations are violated, they usually change their behavior in order to account for the new information (on the margin at least). Does unexpected inflation affect people’s behavior? Of course. William Phillips thought so (the famous version of the Phillips Curve assumes constant inflation expectations).

Macroeconomists often separate the world into reals and nominals. Sometimes we produce more and other times we produce less. Those are the reals. The prices that we pay and the money that we spend are the nominals. There is what’s sometimes called a ‘loose joint’ between reals and nominals. That is, they do not move in tandem, nor are they entirely independent. If the Fed suddenly slows the growth of the money supply, then economic activity growth might also slow – but not by the same amount. In the long run, reals and nominals are largely independent. Whether we have 2% vs 3% annual inflation over the course of some decade is probably not important for our real output at the end of that decade.

It Takes Two to Tango.

It is often said that the Fed can achieve any amount of total spending in the economy that it prefers. It can achieve any NGDP. But, the Fed doesn’t control NGDP as a matter of fiat. The Fed changes interest rates and the money supply in order to change the total spending in our economy. Importantly, the effect of Fed policy changes is contingent on how the public reacts. After all, the Fed can increase the money supply. But it is us who decides how much to spend.

Continue reading