As a new quick rule of thumb inspired by the Nature papers, you could do worse than “cut estimated effect sizes in half”. If a published paper says that a college degree raises wages 100%, then chances are the degree really does raise wages, but more like 40–50%. In 2005, John Ioannidis said that “most published research findings are false”. By 2026, we seem to have improved to “most published research findings are exaggerated.”
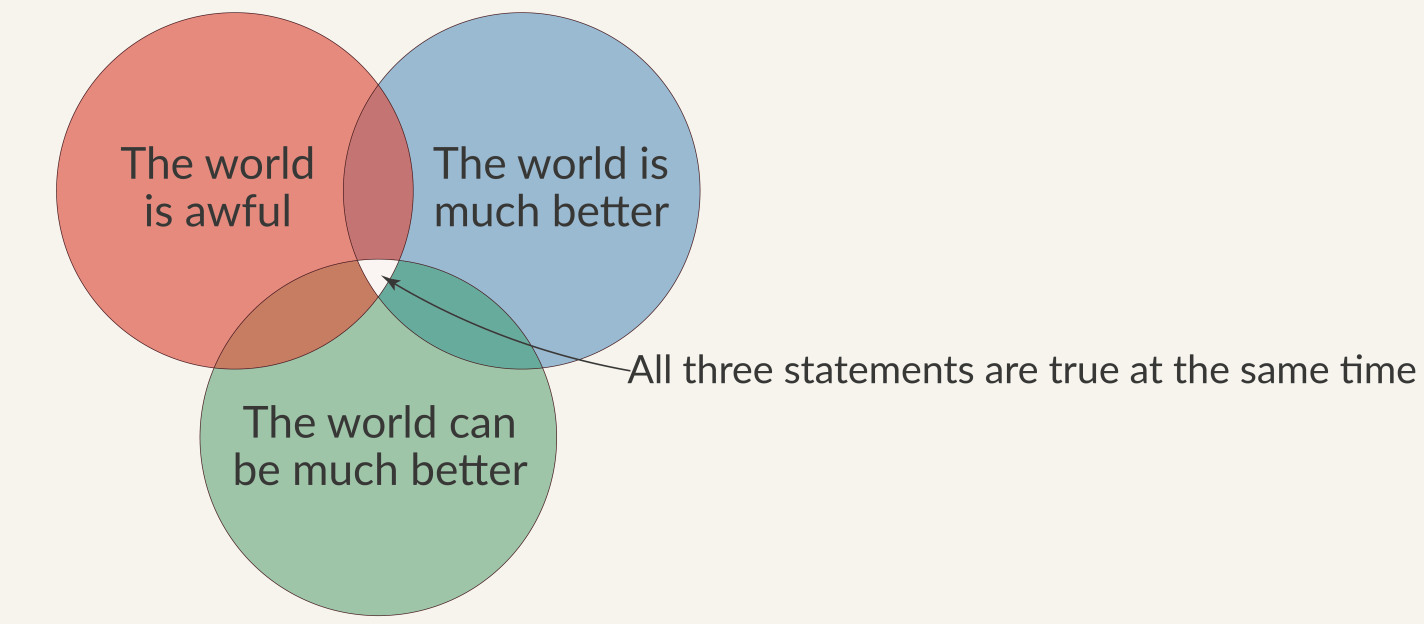
There’s plenty of both good and bad news for economics and the social sciences in both my piece and the Nature special issue it describes. It’s kind of like the Our World in Data motto:
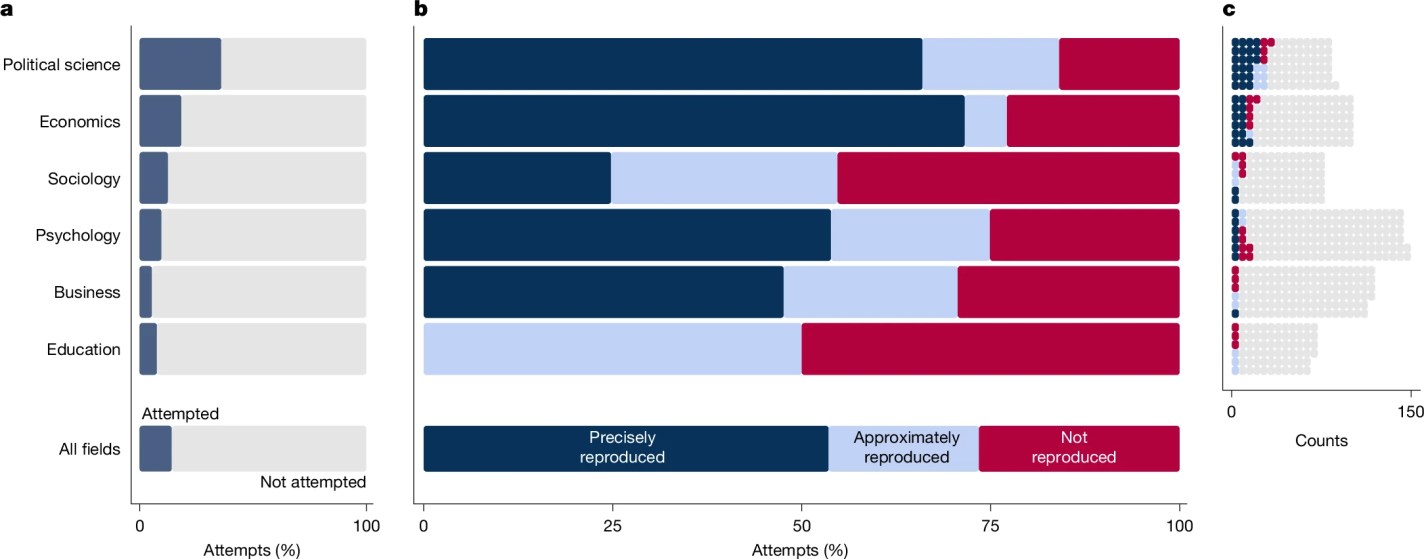
In short, our attempt to replicate hundreds of papers showed that published social science results shouldn’t be trusted precisely today, but they seem to be getting more reliable over time, and they are much more reliable than chance. Economics and political science look the best, though we are still very far from perfect:
Congressional districts must be redrawn after each US Census. In fact, that is one of the main functions the Census: to determine how many seats of the US House of Representatives that each state is allotted. A related function is to give states information about the distribution of the population in their state. Even if a state doesn’t gain or lose seats after a Census, the population in their state may have grown, shrank, or simply moved around within the state. If each Congressional district is to represent roughly the same number of people, district boundaries will still need to be redrawn even absent a change in the state’s total share of the US House seats.
That much is clear. However, given that historically and still largely today Congressional districts are drawn by state legislatures, there is a temptation and a real possibility that the party in power of a state legislature will draw boundaries in a way that benefits that party. There is nothing illegal about doing this as far as the federal Constitution is concerned (that I am aware of), but it does seem a bit unsporting. But I guess much of politics might be deemed “unsporting.”
Nonetheless, sometimes the shape of districts is so obviously weird and not representing an cohesive group of citizens or communities that it gets the derisive term “Gerrymander,” which derives from a historical example of a very odd looking district. But even if a district doesn’t look weird, it may still give one party an advantage that some deem unfair, such as by diluting one party’s supporters into multiple districts so they get no seats, or alternatively cramming all the supporters into one district so they have a very lopsided victory in just one district, rather than controlling multiple districts. This practice is known as “partisan Gerrymandering,” and it will be my focus in this post today (there are other forms, such as racial Gerrymandering, which are also important but are beyond the scope of this post).
Surely this practice occurs. Some states have tried to avoid it the problem of Gerrymandering by using non-partisan commissions, though this is a minority of states (less than a dozen), and when push-comes-to-shove they don’t actually seem that committed to the idea (both California and Virginia have essentially abandoned these commissions in 2025-26 to attempt to, once again, gain a partisan advantage). But lately a particular question has come up: does partisan Gerrymandering benefit one major party more?
In total for the US House, whatever Gerrymandering at the state level that is happening seems to roughly wash out in national representation: in the 2024 election, Republicans received about 51.7% of the two-party share of votes totaled over all House elections, and Republicans have about 50.6% of the seats in the House. Perhaps you could say that the GOP effectively loses 5 seats to what they “should” have in a truly proportional sense, but this ignores many factors, some of which I will discuss below. But even so, the GOP has a slim majority in the House and they won a slim total of national House votes. It’s about right.
But that “washing out” at the national level ignores some very large disparities at the state level. In some states, one party has all the House seats, even though they got nowhere near 100% of the House vote. Many of these are states with 1 or 2 House seats, which are less interesting because either there is no possibility of Gerrymandering (1 seat) or there is no obviously “fair” division, but it is not only those small states. For examples, Massachusetts gives all 9 seats to the Democrats, even though Republicans received 31.5% of the two-party vote share. Do Republicans deserve 3 of the seats? Is the fact that they don’t have 1/3 of the seats evidence of Gerrymandering? Conversely, in Oklahoma Republicans hold all 5 seats, even though Democrats got 30% of the vote. Should Democrats get a seat or two in Oklahoma?
(Note: for all vote data, I have queried Google Gemini Pro. I found multiple errors along the way, but I am fairly confident the numbers are all correct now. Please let me know if you spot any errors).
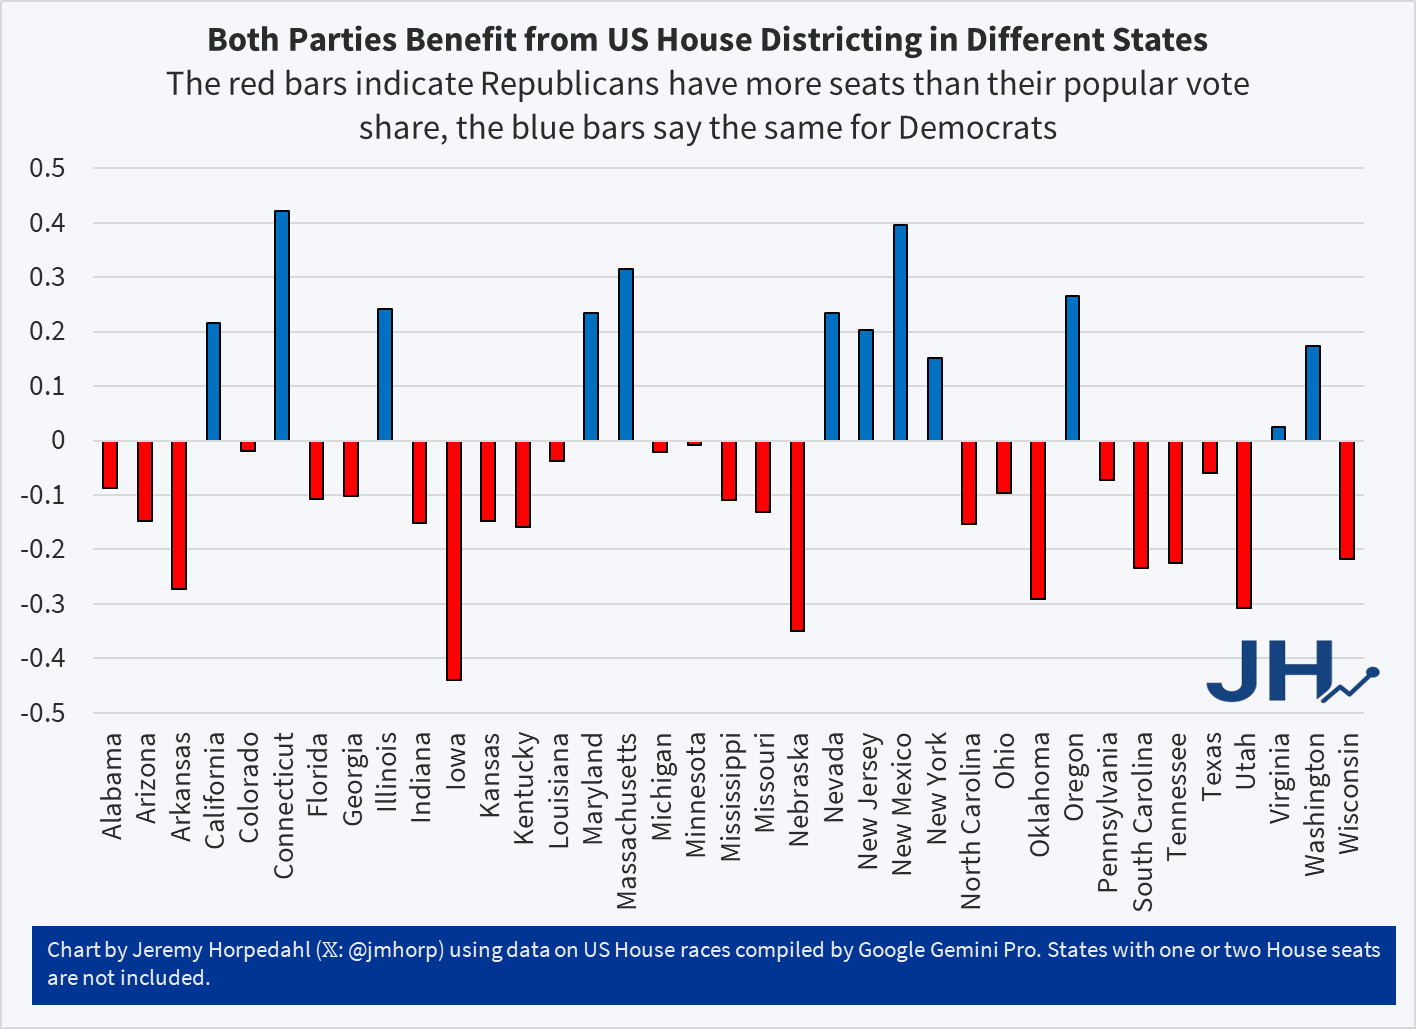
Neither Massachusetts nor Oklahoma’s Congressional representation is an obvious case of Gerrymandering on its face. It’s possible that 1/3 opposition party support in both states is perfectly even distributed across the state, such that it would not be possible to draw any “fair” districts that give the opposition roughly 1/3 of the seats. But it could be the result of Gerrymandering, or at least an indication we should look deeper. We can tally up all of the differences across states in the following chart:
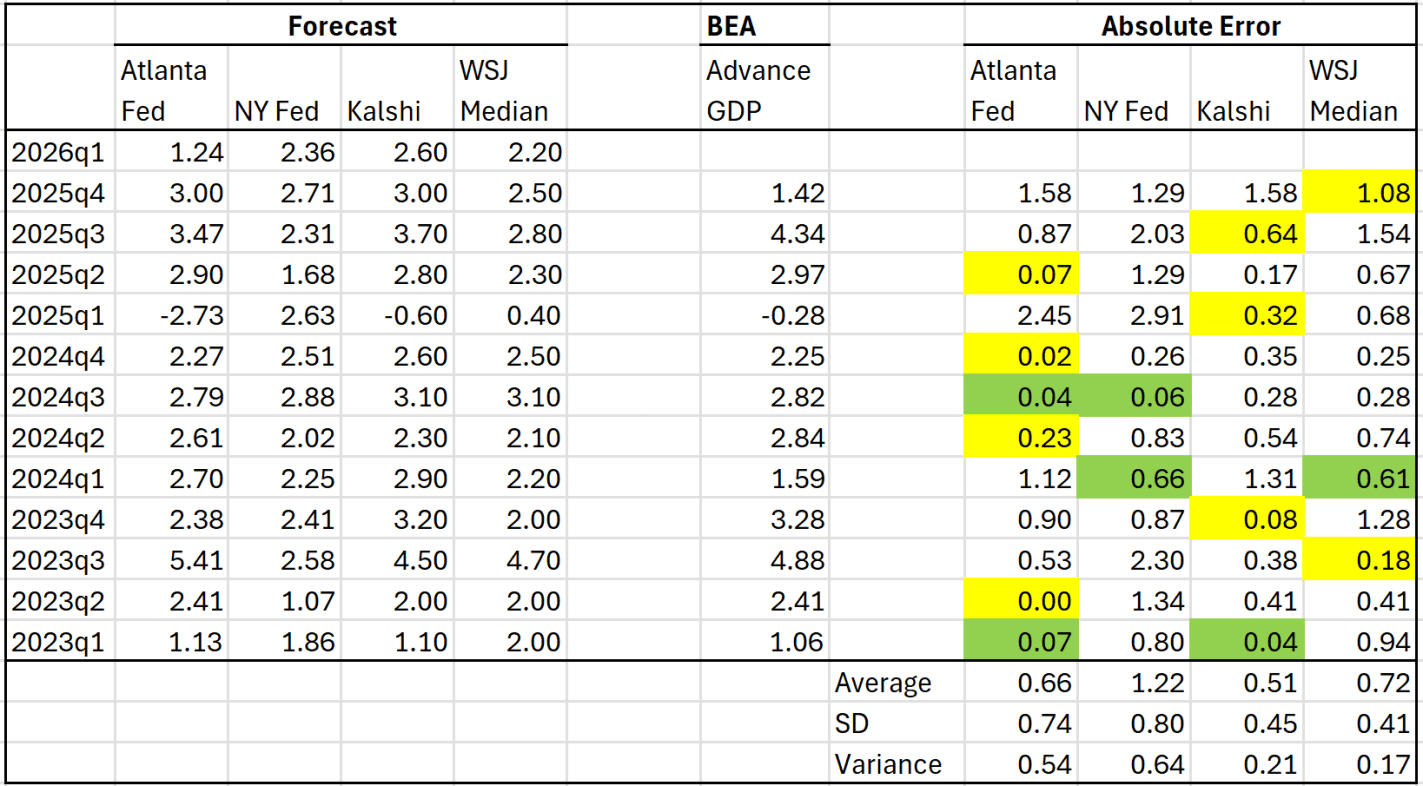
Forecast models, betting markets, and surveys of experts all drastically overstated the actual growth of GDP in the last quarter of 2025. They were off in the initial release, which was just 1.4 percent, but this was even further revised down to 0.5 percent. All four of the sources I track were forecasting over well over 2 percent, with some over 3 percent.
Does that mean we shouldn’t trust the forecasts? Perhaps, but last quarter was largely pulled down by government spending cuts, which the models completed missed. You can see this very clearly in the Atlanta Fed GDPNow model. Perhaps they shouldn’t have been surprised by this drop in government spending, but that is where the major error was.
So what do these forecasts think about the first quarter data for 2026, which comes out tomorrow? The two best predictors historically, GDPNow (Atlanta Fed) and Kalshi, are pretty far apart on this one, over a percentage point difference, with GDPNow being the only forecast under 2 percent:
My university recently hosted a guest speaker. Among their content, they included some nominal macroeconomic values from pre-2020, back in the era when inflation was very low. That roughly includes the years 2012-2019. Truly, inflation stayed below 2% through February of 2021, but I think that we can all agree that the economy was different in a few ways beginning in 2020.
I asked the speaker why not express the nominal values in real terms. They were emphatic that the low rates of inflation at the time implied that the signal-to-noise ratio was too low. Therefore, the ‘real’ inflation adjusted values would not be more precise because excessive noise would be introduced into the series during a period when not much deflating was necessary in the first place.
1) It may be information is incomplete and becomes more complete as time passes. This sort of noise only exists in the short-run and is resolved as more information becomes available later in time. Revisions tend to happen each month for prior months, as well as each year for prior years. There are also big revisions after methodological, consumption weight, and data source changes.
2) Another type of noise is due to incomplete information that is never resolved. After all, the government statisticians can’t see literally all of the transactions. Those unobserved transactions will never make it into the official inflation measures and we’ll never get a perfect picture.
3) Methodological artifacts may also include known biases. This type of noise doesn’t get corrected except after major changes to the series. If those changes never happen, then we just sort of live with imprecision. Luckily, so long as the bias is consistent, then percent change in the price indices will approximate the underlying true levels. However, if there are non-random biases in the percent change, then it can cause some trouble.
One way to get an idea for the amount of noise in the data is to observe the magnitude of revisions. Of course, this only helps us with the first type of noise above that eventually gets resolved with more information. It’s much harder to get a handle on the imprecision that is not identifiable. The Philadelphia Federal Reserve Bank provides an easy-to-use database that puts all of the archival and revised numbers for many macro series in a single place: the Real-Time Data Set (RTDS). It includes every historical PCE price index value for each publication month. Let’s limit our sample to the 21st century.
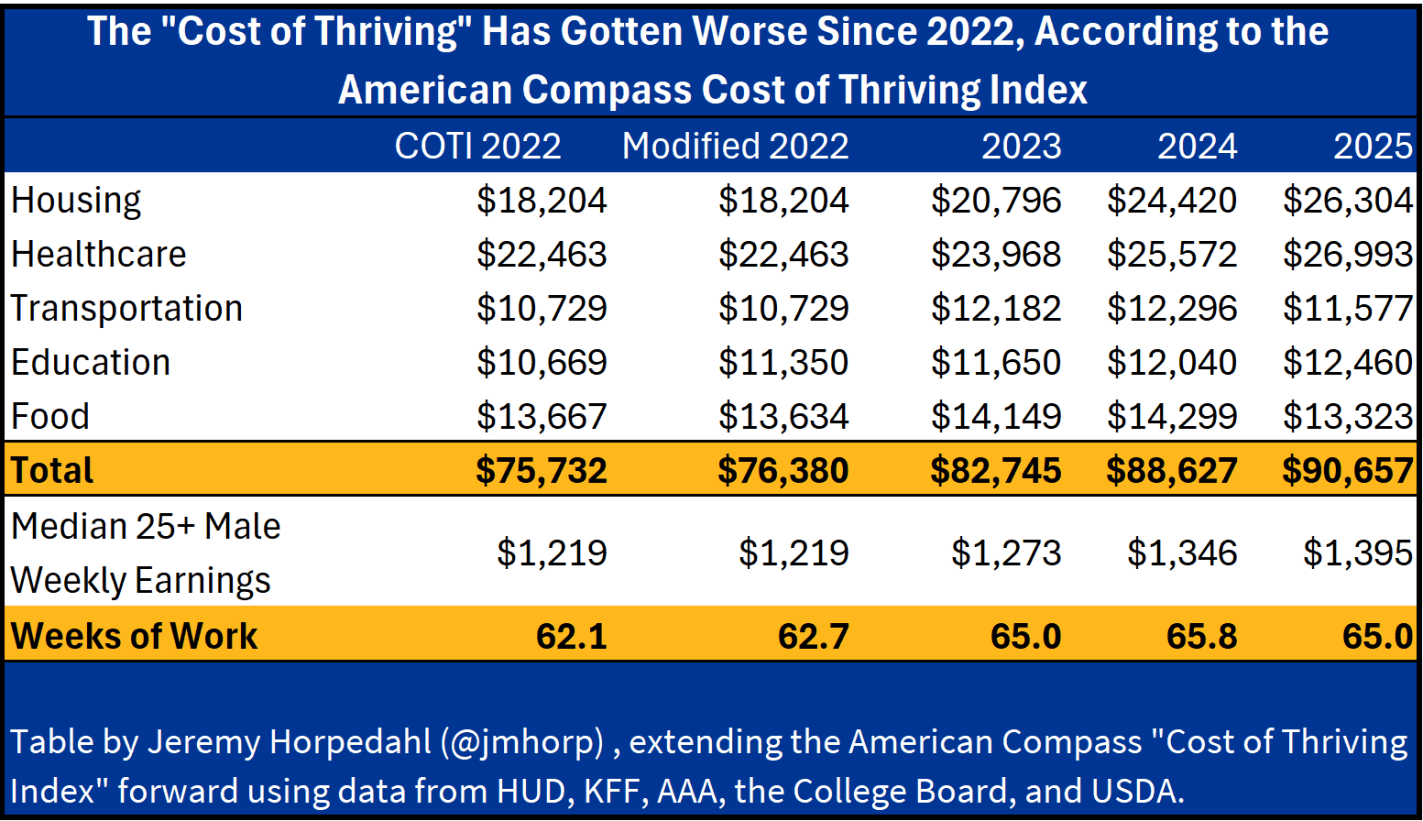
The Cost of Thriving Index from Oren Cass’s American Compass is an attempt to calculate how well US families are doing financially, but without using traditional inflation adjustments to income. Instead, Cass and crew have chosen 5 categories of goods and services, and tracked those over time relative to median earnings for men ages 25 and older (in the baseline model — it can also be applied to different categories of workers).
Scott Winship and I wrote a detailed critique of the COTI, which I summarized in a previous blog post. Our critique comes from several angles, including correcting several major errors in COTI, as well as arguing that standard inflation adjustments to median income are superior to this new approach.
Based on our critique, I don’t think COTI is a very good measure of how well US families are doing financially. But the COT Index still has many fans. And Cass seems to think Trump is in large part pursuing many policies that should help out US workers and families, such as Trump’s tariff policies. Thus, it will be useful to see if Trump’s policies are leading to American workers “thriving” in the first year of Trump’s presidency.
Unfortunately, even using Cass’s preferred approach, Americans don’t appear to be thriving under Trump.
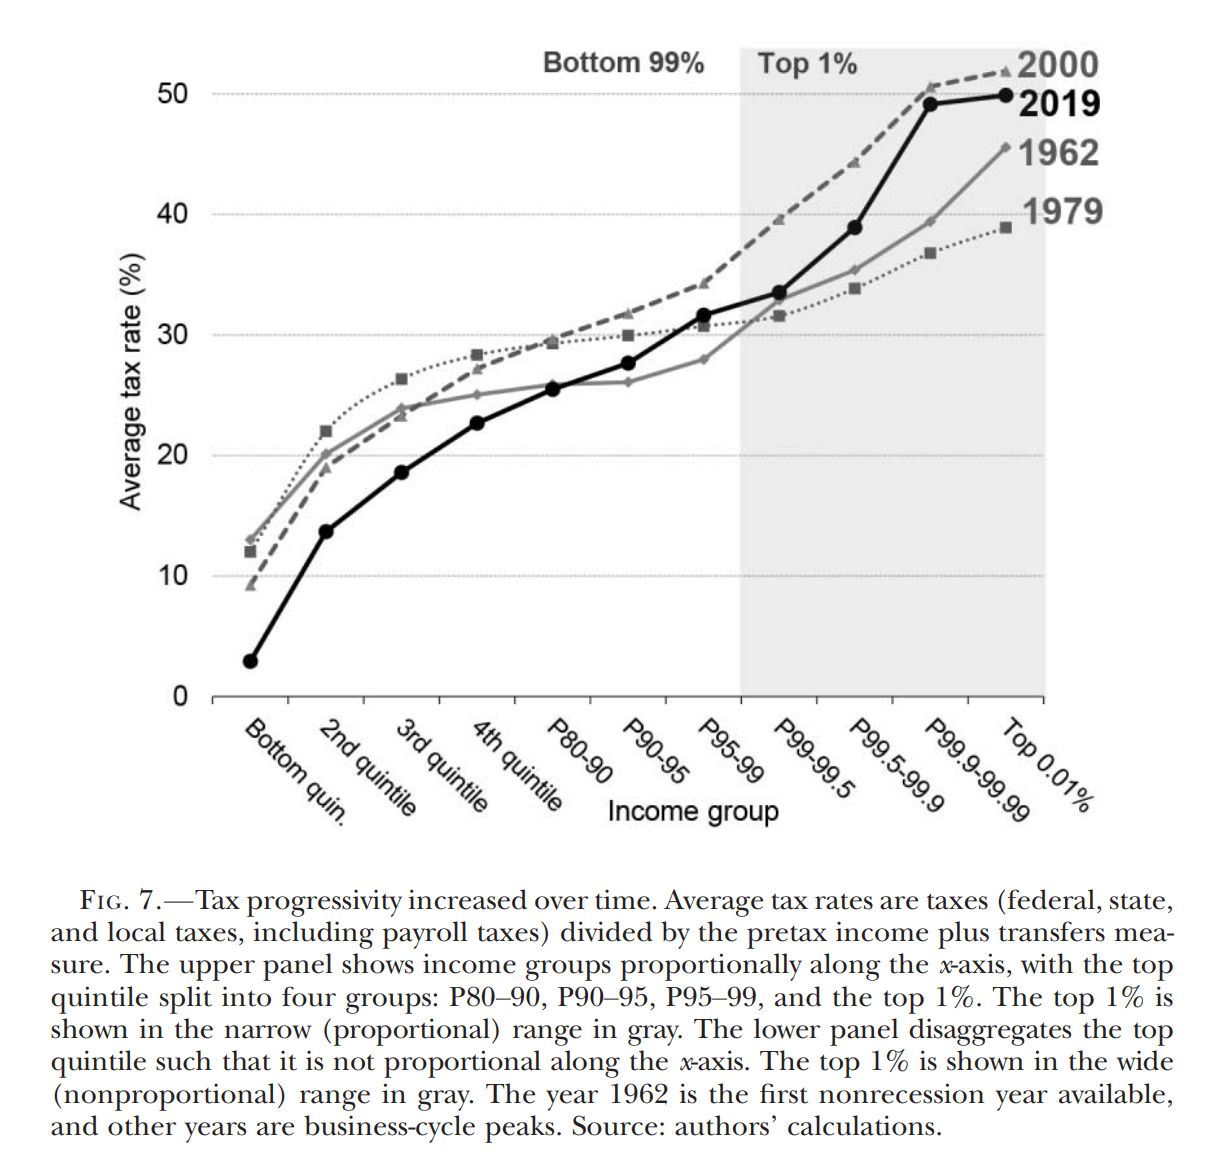
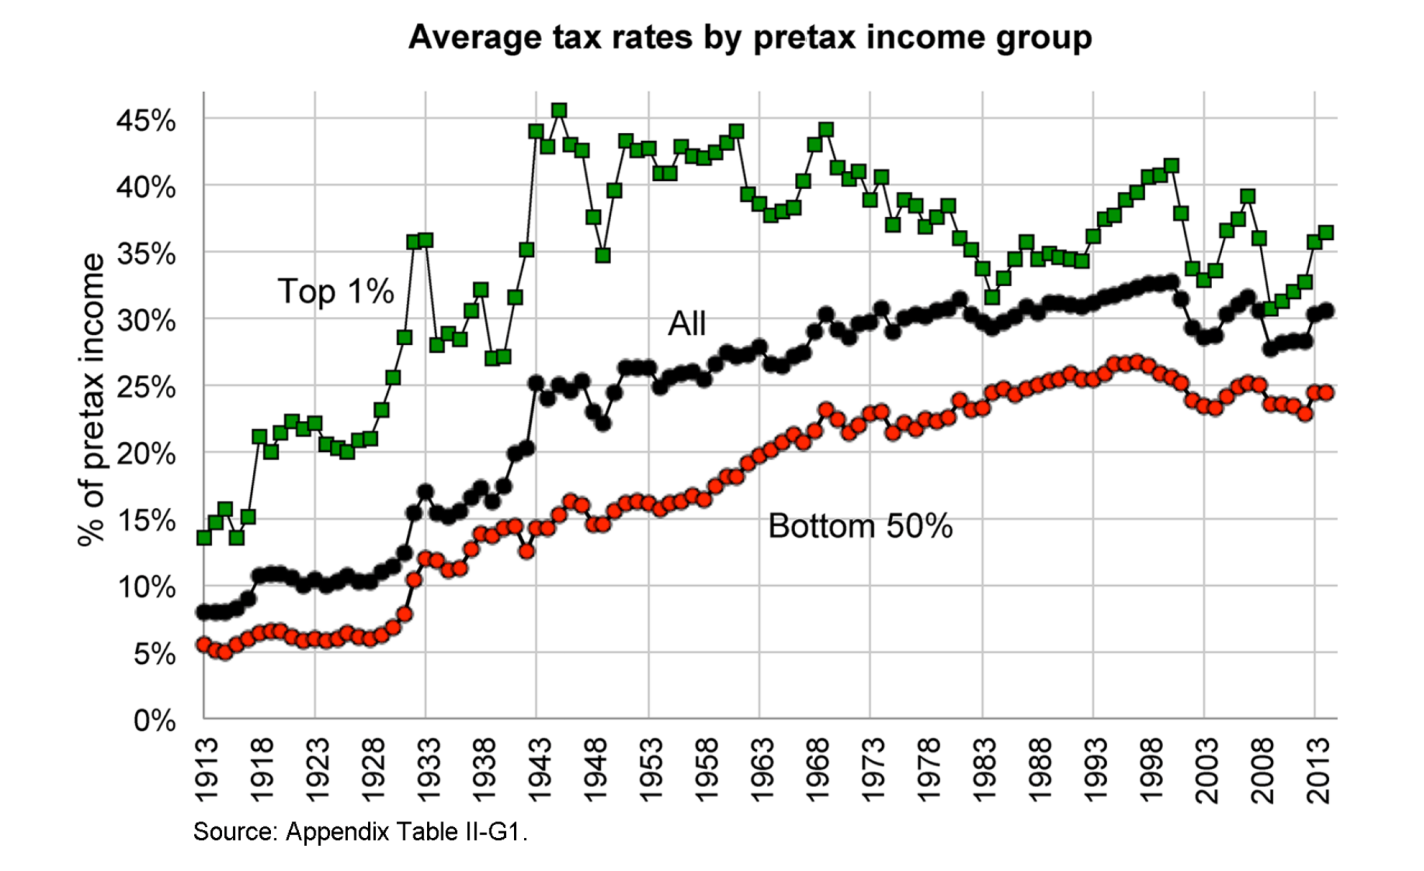
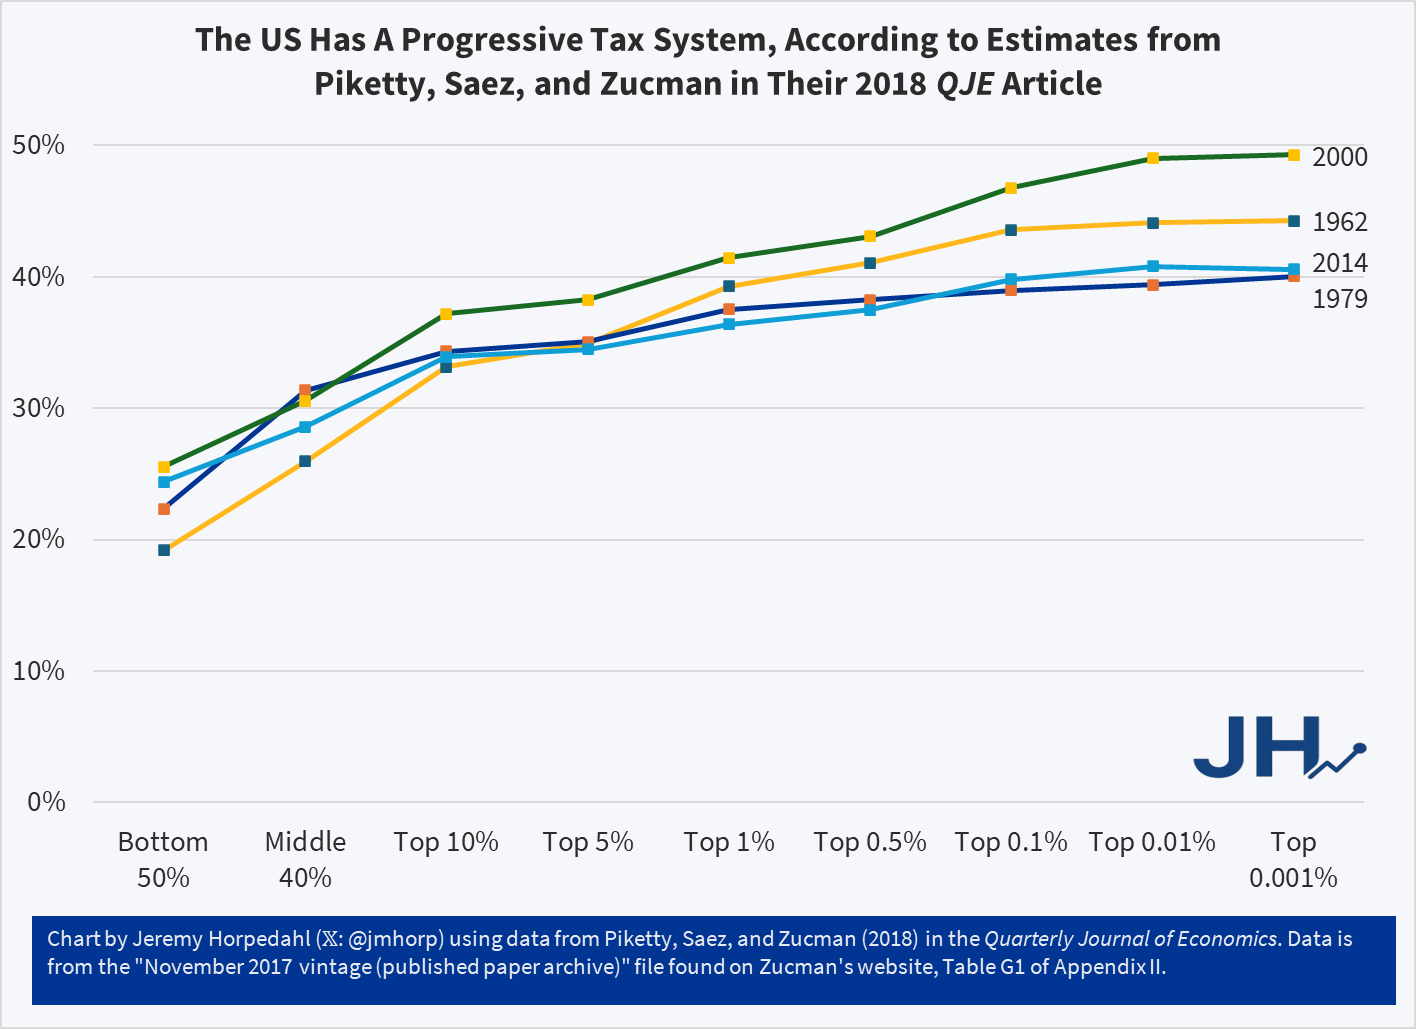
For Tax Day 2026, here are some estimates of how progressive the US tax system is, drawing primarily from published academic work. While there is disagreement about exactly how progressive the tax system is (and should be), these papers all agree that as income rises, average tax rates rise. These estimates attempt to include, as best as possible, all federal, state, and local taxes, and to take account of tax incidence.
And here is a chart that I created, which comes from the appendix data for PSZ (2018), which is roughly comparable to the Auten-Splinter chart above. Note that it isn’t perfectly comparable: the income groups on the x-axis aren’t exactly the same, and the latest year in PSZ is 2014 rather than 2019 (they do have estimates for later years in updates to the work, but I am trying to stick with the published academic work). But they are roughly comparable:
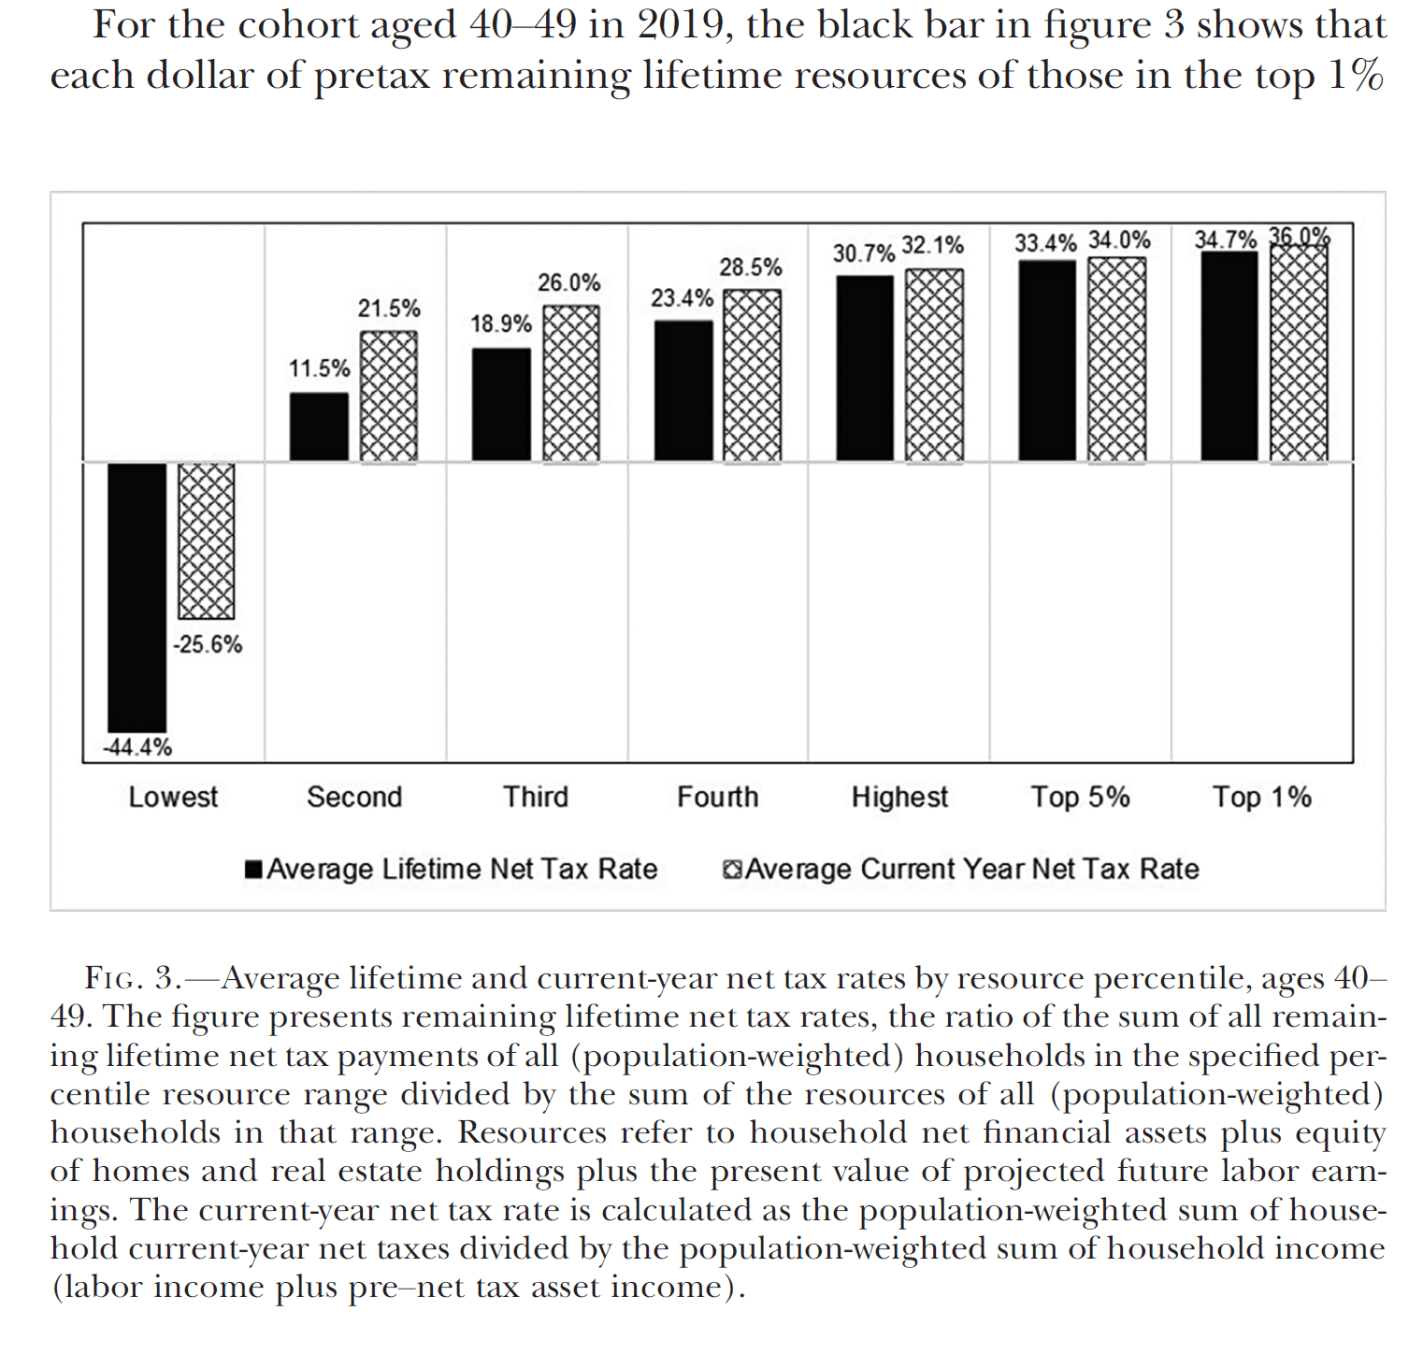
Auerbach, Kotlikoff, and Koehler in the Journal of Political Economy take the additional step of computing lifetime average tax rates, rather than for a single year, showing the US tax system is even more progressive when considered this way. Note: they also include the value of transfers, which makes these results not directly comparable to the papers above:
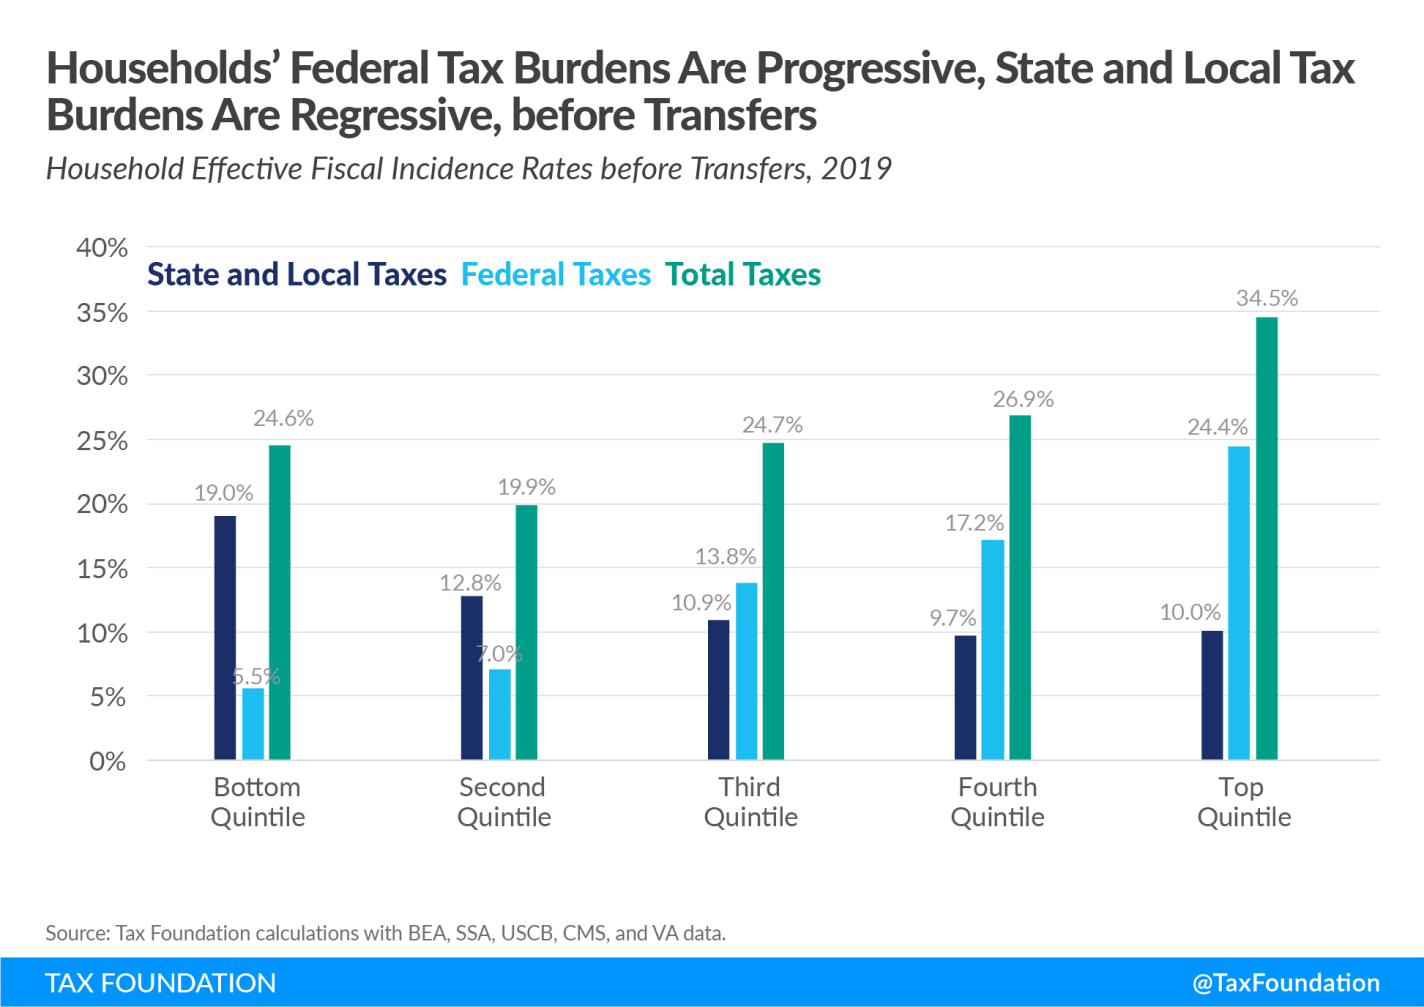
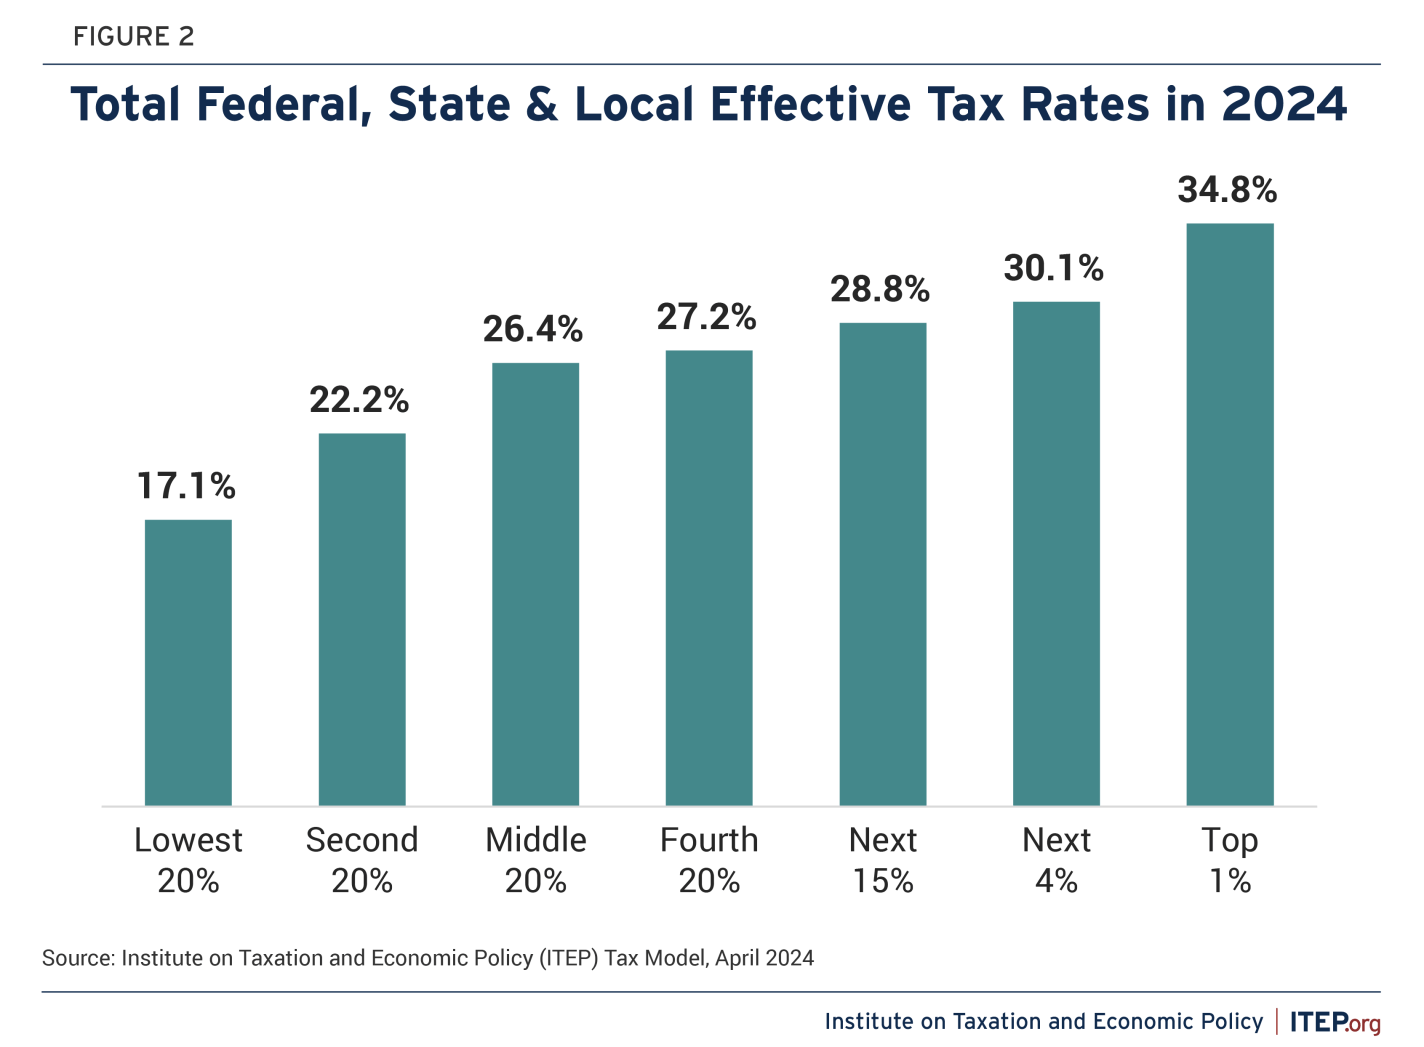
Finally, here are two estimates from think tanks that work on tax policy. Even though the Tax Foundation is considered more right-leaning and ITEP is considered more left-leaning, both agree that the overall US tax code is progressive.
For the talk of the future of generating art, let’s not forget the task of remembering the art we’ve already made. Behold: more than 10,000 cassette recorded concerts, from as far back as 1984, recorded in community centers, church basements, taverns, all-ages clubs, and hundreds of other unsung “venue” owners who let then (and often always) unknown bands play shows for a a couple dozen attendees, all in the hopes that door money and beverages might keep the owner out of the red on a random weeknight while.
But maybe not. Maybe the internet can and does, in fact, remember. Because while there is a lot to be absorbed from the finished product, but there is often so much more learn from the imperfect and unpolished early stages. A band before they slowed down or ventured beyond their first 3 chords, a writer still stuck in the first person, a disseratation chapter still haunted by the writing of the insecure graduate student we all were. The awkard phases when an artist (or artists) are still finding their voice. Perhaps, more than ever, we need to remember the importance of not skipping over the embarassing, exhausting, and, yes, often futile work at the beginning and middle. There are more shortcuts than ever to making a thing, but no shortcut to becoming the version of yourself that can make the thing that only you can make.
Vice President Vance’s recent trip to Hungary to stump for Viktor Orban was interesting for a number of reasons, but is not totally surprising. In many ways Orban’s “illiberal democracy” (his self-applied term) has many overlaps with MAGA Republican policy. Johan Norberg recently wrote a very good critique of Orban’s policies, and why the US should not follow further down the path or Orbanism.
I agree completely with Norberg’s analysis completely, though his focus is mostly on the decline in democracy, the rule of law, and personal freedoms in Hungary under Orban. Norberg does have several criticisms of Orban’s economic policies, but on the whole economic policy under Orban has been relatively unchanged: in the Human Freedom Index report Norberg cites, the “personal freedom” portion of the index declined 1.5 points on a 10-point scale under Orban, while the “economic freedom” portion only declined by 0.3 points.
What’s really interesting is that within the Economic Freedom of the World Index, Hungary’s highest scoring area of the five areas is “freedom to trade internationally,” where they ranked the 25th best country in the world in 2023. While MAGA Republicans might like the US to copy many of Hungary’s policies, they clearly do not in this case, as trade restrictions one of the signature economic policies of Trump (possibly his most important economic policy).
To be clear, the high ranking on free trade in Hungary is not due to any conscious policy choice of Orban’s administration. Instead, it is because Hungary is a member of the European Union, and therefore is part of the single market (meaning they have free trade with most of their trading partners) and part of the customs union (meaning they can’t set their own external trade policy). Indeed, it appears if Orban had his way, they would have much less free trade, as he is trying to hold up the EU-Mercosur trade agreement. Nonetheless, Orban’s hands are largely tied on trade policy.
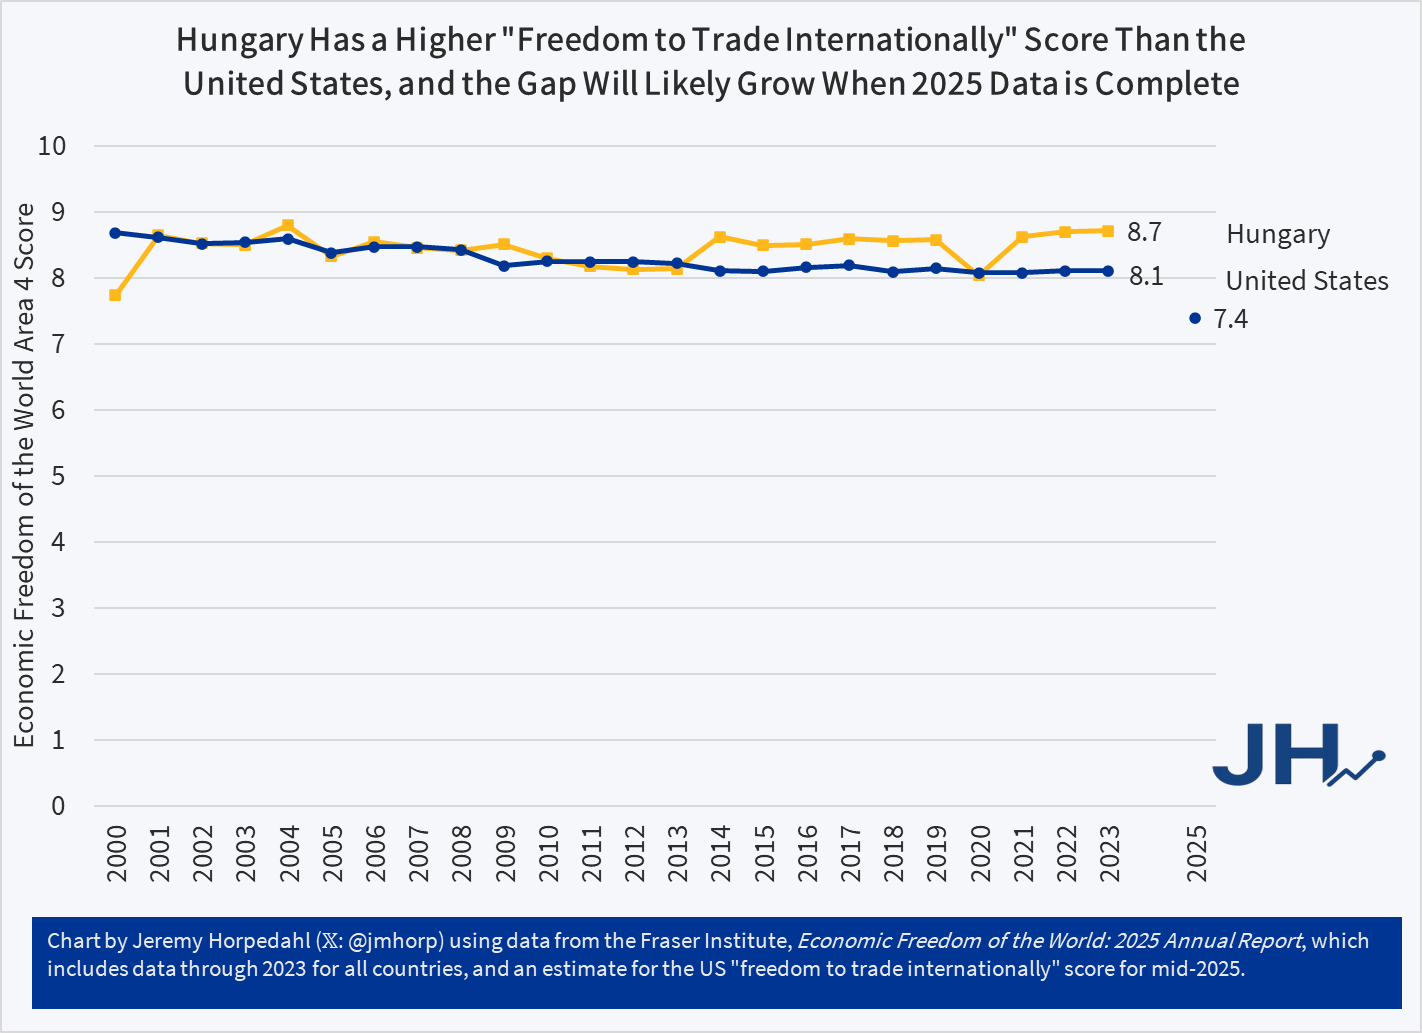
Not only was Hungary ranked quite high on free trade in 2023, they were ranked higher than the US, as they have been for most of the past decade:
While the EFW data is generally only available with a significant lag, and therefore only through 2023 in the chart above, they did provide a special update for the US in mid-2025, given the radical changes in trade policies by the second Trump administration. That’s the blue dot you see floating down below with a score of 7.4. While that isn’t the final ranking for 2025 (they still don’t have the scores for 2024!), it gives an indication of roughly where the US will land in 2025, making it much less free trading than Hungary.
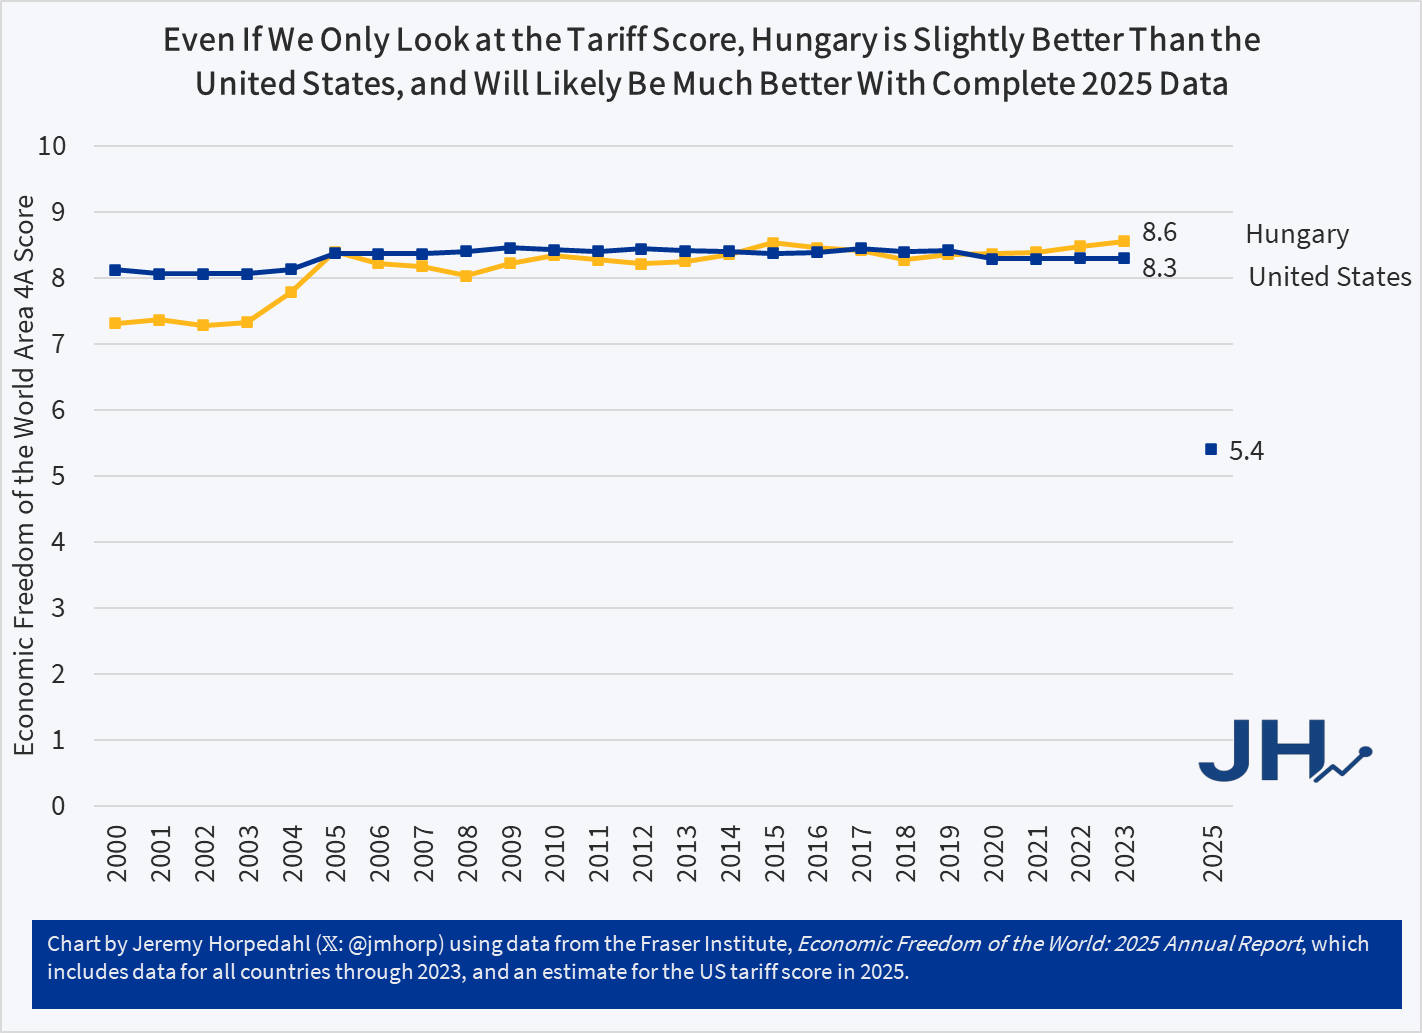
The EFW Area 4 score includes not just tariff rates, but also non-tariff barriers to trade, as well as capital controls and labor movement. What if we only focus on the tariff sub-score, since this is the part of trade policy Trump has altered the most?
On tariff policy alone, there wasn’t much difference between the US and Hungary in 2023 (indeed, if we look solely at tariff rates, the US was slightly better, with an average rate of 3.3% compared with 5.0% in Hungary). But with the radical change in rates in 2025, Fraser estimates that the US will drop significantly, giving it one of the highest average tariff rates in the world. This would be a massive difference between Hungary and the US on trade policy. We’ll have to wait for the complete data before making a final judgement, and indeed given that average tariff rates have changed more than 50 times under the second Trump administration already, it’s not even clear what our score will be for 2025. But it will almost certainly be worse than Hungary.
Americans like their food. Holidays are often known by the dishes that we serve. Thanksgiving is a bit unique in that most of us converge on turkey, though diversity obviously exists. What about Easter? There’s not really the same focus on a single food like there is for Thanksgiving. My impression is that people eat daytime or lunch foods that include ham, lamb, or just about anything. My family tends to make tacos.
What am I saying?! We eat candy! Solid or hollow chocolate bunnies, jellybeans, peeps, and on and on. We fill Easter eggs and keep candy around the office. We literally have baskets full of candy.
A Chocolate Bunny? In this economy?
Have you seen the price of chocolate? Yeesh! The latest figures are from February and the prices for chocolate and cocoa bean products are down 11.7% year-over-year. That’s nice, you may think, our budgets can fit a bit more chocolate into our consumer – I mean Easter – baskets. Great news. The news seems a little less great when you realize that February’s price of chocolate was 90% higher than it was four years earlier in 2022. 90% higher is a lot like 100%, and 100% is double! In fact, the price had peaked at 142% higher by September of 2025, and now prices are quickly falling. See the chocolate-colored line in the graph below.
Common sense and Bayes’ Rule agree: extraordinary claims require extraordinary evidence
Trust more when papers publicly share their data and code
Trust higher-ranked journals more up to the level of top subfields (e.g. Journal of Health Economics, Journal of Labor Economics), but top general-interest journals can be prone to relaxing standards for sensationalist or ideologically favored claims (e.g. The Lancet, PNAS, Science/Nature when covering social science)
More recent is better for empirical papers, data and methods have tended to improve with time
Overall effects are more trustworthy than interaction or subgroup effects, the latter two are easier to p-hack and necessarily have lower statistical power
Trust large experiments most, then quasi-experiments, then small experiments, then traditional regression (add some controls and hope for the best)
The real effect size is half what the paper claims
That last is inspired by a special issue of Nature out today on the replicability of social science research. An exception to rule #4, this is an excellent project I will write more about soon.